
- Title
-
MiR-145 mediates zebrafish hepatic outgrowth through progranulin A signaling
- Authors
- Li, Y.W., Chiang, K.Y., Li, Y.H., Wu, S.Y., Liu, W., Lin, C.R., Wu, J.L.
- Source
- Full text @ PLoS One

miR-145 is one of miRNAs prediction on zebrafish GrnA that affects embryonic liver growth. (A) The miRNAs prediction of GrnA. (B) Liver morphology at 4 dpf was analyzed after control mimic, miR-145 mimic, miR-9 mimic, miR-206 mimic, miR-731 mimic and miR-217 mimic injections in Tg(fabp10:EGFP) embryos. The EGFP expression of Tg (fabp10:EGFP) fish showed a smaller liver phenotype in miR-145 mimic-treated fish compared to wild type, control fish and other miRNAs mimic-treated fish. Thirty embryos per experimental group from one clutch were used and three independent replicates were performed. (C) A 3D image of the liver was analyzed using Leica SP5 confocal microscope and Imaris software. The liver size was examined by measuring the volume of EGFP expression. Ten embryos per experimental group were used and three independent replicates were performed. Scale bars, 100 μm; EGFP, enhanced green fluorescent protein; *P < 0.05, t-test. |
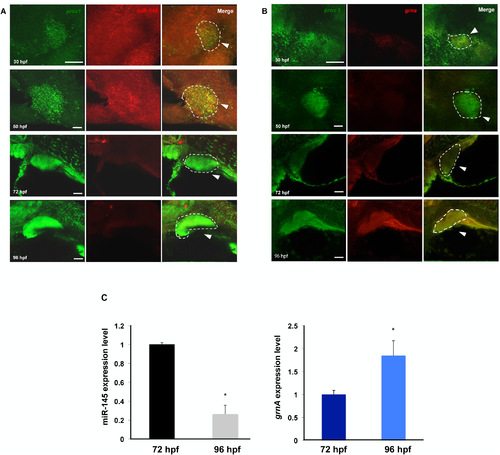
miR-145 and GrnA expression patterns are inversely correlated during liver development. (A,B) The expression patterns of miR-145 (A), grnA (B) and the hepatoblast-specific marker gene prox1 at 30, 50, 72 and 96 hpf were examined using FISH in wild-type zebrafish embryos. Scale bars, 25 μm (at 30 and 50 hpf), 50 μm (at 72 and 96 hpf). The dotted circles indicate prox1 positive cells that represent liver. Ten embryos per experimental group were used and three independent replicates were performed. (C) The fetal liver at 72 and 96 hpf were isolated to quantify liver specific expression patterns of miR-145 and GrnA. Fifteen fetal livers per experiment were used and three independent replicates were performed. The relative expression is normalized with internal control, U6 and ef1a expression. |

miR-145 is critical for liver morphogenesis. Liver morphology at 4 dpf after control mimic (A), miR-145 inhibitor (B) and miR-145 mimic (C) injections in Tg(fabp10:EGFP) embryos. One hundred embryos per experimental group from one clutch were used and three independent replicates were performed. A 3D image of the liver was analyzed using Leica SP5 confocal microscope and Imaris software (D-F). The liver size was examined by measuring the volume of EGFP expression (G). Ten embryos per experimental group were used and three independent replicates were performed. The EGFP expression of Tg (fabp10:EGFP) fish showed an enlarged liver in miR-145 inhibitor-injected fish and an underdeveloped liver in miR-145 mimic-injected fish fish as compared to that in control fish. Scale bars, 100 μm; EGFP, enhanced green fluorescent protein; *P < 0.05, t-test. |

miR-145 is required for hepatic outgrowth. A WISH assay was used for determination of the liver developmental markers hhex at 30 hpf (A-C, dorsal view), sePb at 50 hpf (D-F, dorsal views), prox1 at 72 hpf (G-I, dorsal views) and fabp10 at 96 hpf (J-L, dorsal views) in control, miR-145 inhibitor-injected and miR-145 mimic-injected embryos. The arrowhead indicates liver. The expression levels of hhex, sePb, prox1 and fabp10 were examined using qPCR (M). The ef1a expression level was served as an internal control (*P < 0.05, t-test). Twenty whole embryos per experimental group were used and three independent replicates were performed. |
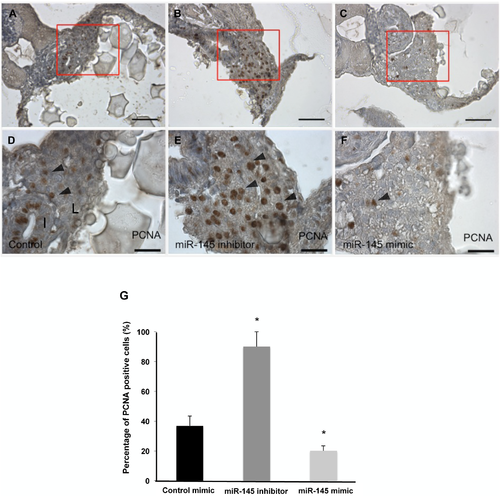
miR-145 modulates hepatocyte proliferation in zebrafish embryos. The liver sections of control mimic-, miR-145 inhibitor- and miR-145 mimic-injected fish were examined using PCNA staining at 4 dpf. The liver sections of three embryos per experimental group were used and three independent replicates were performed. miR-145 inhibitor-injected fish had more PCNA-positive hepatocytes (B, E) as compared to those in control (A,D). In contrast, a low signal was detected in response to miR-145 mimic treatment (C,F). The arrowhead indicates PCNA-positive hepatocytes. The percentage of PCNA-positive hepatocytes was counted (G). The blue staining is hematoxylin stain; I, intestine; L, liver; Scale bars, 20 μm; *P < 0.05, t-test. |
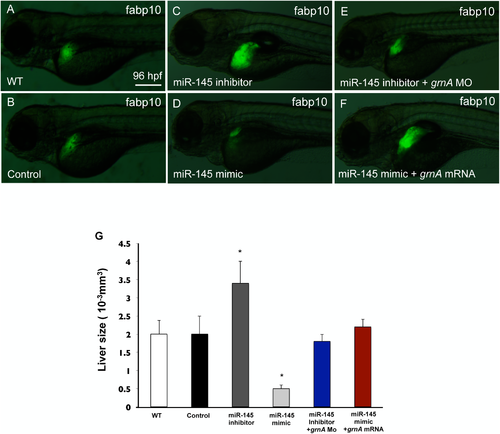
GrnA rescues the hepatic outgrowth defect caused by miR-145 manipulation. Liver morphology was determined by EGFP expression at 4 dpf in Tg (fabp10:EGFP) embryos (A) or in embryos injected with control mimic (B), miR-145 inhibitor (C), miR-145 mimic (D), miR-145 inhibitor with grnA MO (0.25 ng/embryo) (E) and miR-145 mimic with grnA mRNA (0.4 ng/embryo) (F). Thirty embryos per experimental group were used and three independent replicates were performed. A 3D image of the liver was observed using Leica SP5 confocal microscope and Imaris software. The liver size was examined by measuring the volume of EGFP expression (G). Ten embryos per experimental group were used and three independent replicates were performed. Scale bars, 100 μm; EGFP, enhanced green fluorescent protein; *P < 0.05, t-test. |

miR-145 mimic and miR-145 hairpin inhibitor treatment specificity and efficiently regulate miR-145 expression in vivo. The miR-145 expression pattern at 72 hpf was examined using WISH and qPCR in control-, miR-145 inhibitor- and miR-145 mimic-injected fish. At 72 hpf, WISH indicates normal miR-145 expression in control-injected fish (A and B), reduced miR-145 expression in miR-145 inhibitor-injected fish (C and D) and overexpression of miR-145 in miR-145 mimic-injected fish (E and F). (A, C and E are dorsal views; B, D and F are lateral views). The qPCR analysis reveals that the miR-145 mimic and inhibitor modulate miR-145 expression (G). In addition, the qPCR analysis reveals that gata6 expression is regulated by altered expression of miR-145 (H). The ef1a and U6 expression was measured as a loading control. (**, P < 0.01, t-test; the arrow indicated liver, thirty embryos per experimental group were used and three independent replicates were performed). |
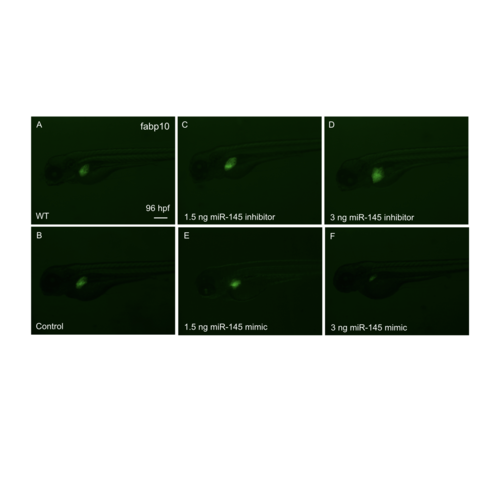
The dose-dependent effects of miR-145 mimic and inhibitor on hepatic outgrowth. Liver morphology at 4 dpf after 1.5 ng and 3 ng control mimic, miR-145 inhibitor, miR-145 mimic injection in Tg(fabp10:EGFP) embryos. (Scale bars, 200 μm; EGFP, enhanced green fluorescent protein; thirty embryos per experimental group were used and three independent replicates were performed). |
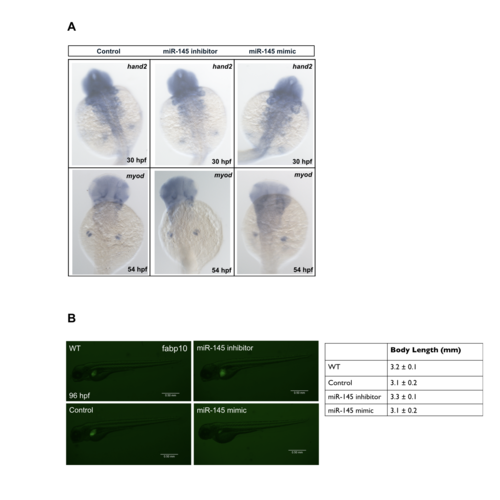
The developmental growth is normal under altered expression of miR-145. Two mesodermal genes, heart and neural crest derivatives expressed transcript 2 (hand2) at 30 hpf and myogenic differentiation 1(myod) at 54 hpf was examined using WISH. The result reveals mesoderm development was not significantly affected by manipulation of miR-145 expression (A). The body length were measured at 96 hpf after control mimic, miR-145 inhibitor, miR-145 mimic injection in Tg(fabp10:EGFP) embryos (B). (Scale bars, 0.50 mm; thirty embryos per experimental group were used and three independent replicates were performed). |

The three doses of GrnA rescue the hepatic outgrowth defect caused by miR-145 manipulation. Liver morphology was determined by EGFP expression in Tg(fabp10:EGFP) embryos at 4 dpf (A) or in embryos injected with control mimic (B); miR-145 inhibitor (C); miR-145 mimic (D); miR-145 inhibitor with three doses of grnA MO 0.0625 ng/embryo (E), 0.125 ng/embryo (F), or 0.25 ng/embryo (G); and miR-145 mimic with three doses of grnA mRNA 0.1 ng/embryo (H), 0.2 ng/embryo (I), or 0.4 ng/embryo (J). (Scale bars, 100 μm; thirty embryos per experimental group were used and three independent replicates were performed). |