
- Title
-
Development of a Whole Organism Platform for Phenotype-Based Analysis of IGF1R-PI3K-Akt-Tor Action
- Authors
- Liu, C., Dai, W., Bai, Y., Chi, C., Xin, Y., He, G., Mai, K., Duan, C.
- Source
- Full text @ Sci. Rep.
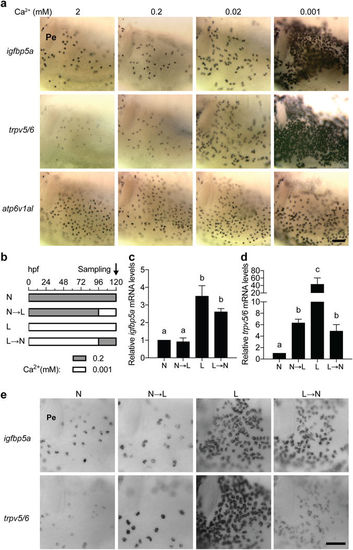
The igfbp5a gene is specifically expressed in NaR cells. (a) Wild type zebrafish embryos were raised in embryo rearing solution containing the indicated [Ca2+] from 0 to 120 hpf (hours post fertilization) and analyzed by whole-mount in situ hybridization using the indicated probes. Images shown are the yolk sac region. Scale bar = 50 μm. Unless specified otherwise, all in situ hybridization images shown hereafter are lateral views, anterior to the left and dorsal up. (b–e) The trpv5/6 and igfbp5a genes respond differentially to [Ca2+] changes. The experimental design is shown in (b). The mRNA levels of igfbp5a (c) and trpv5/6 (d) were measured by qPCR and normalized by the β-actin mRNA levels. Data shown are mean ± SEM, n = 3. Different letters indicate significant differences at p < 0.05. (e) The larvae described in (b) were analyzed by in situ hybridization using the indicated probes. Representative images are shown. |

ZFIN is incorporating published figure images and captions as part of an ongoing project. Figures from some publications have not yet been curated, or are not available for display because of copyright restrictions. EXPRESSION / LABELING:
PHENOTYPE:
|
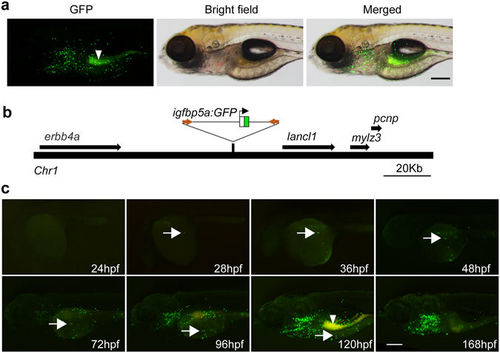
Characterization of the stable Tg(igfbp5a:GFP) fish line. (a) Lateral view of a 120 hpf transgenic Tg(igfbp5a:GFP) larva. The GFP-labeled cells are located in the yolk sac region and gills. Auto-fluorescence is indicated by an arrowhead. Scale bar = 0.2 mm. (b) Schematic diagram showing the genomic integration site. (c) Developmental pattern of GFP-labeled cells. Arrows indicate the emergence of GFP-positive cells and its subsequent location in the indicated stages. Auto-fluorescence is indicated by an arrowhead. EXPRESSION / LABELING:
Construct:
TgBAC(igfbp5a:GFP)
|

Tg(igfbp5a:GFP) fish faithfully recapitulates low [Ca2+] stress-induced NaR cell proliferation. (a) The GFP transgene is specifically expressed in NaR cells. Tg(igfbp5a:GFP) larvae (72 hpf) were transferred to embryo rearing solution containing the indicated [Ca2+]. 48 hours later, they were analyzed by in situ hybridization for igfbp5a mRNA expression (green, left panels) and GFP immunostaining (red, middle panel). Merged views are shown in the right panels. Scale bar = 50 μm. (b,c) Changes in NaR cell number (b) and GFP fluorescence intensity (c) under normal [Ca2+] at the indicated time points. Values shown are mean ± SEM. n = 7. Different letters indicate significant differences at p < 0.05. (d,e) Changes in NaR cell number (d) and GFP fluorescence intensity (e) under low [Ca2+] at the indicated time points. Values shown are mean ± SEM. n = 11. Different letters indicate significant differences at p < 0.05. |
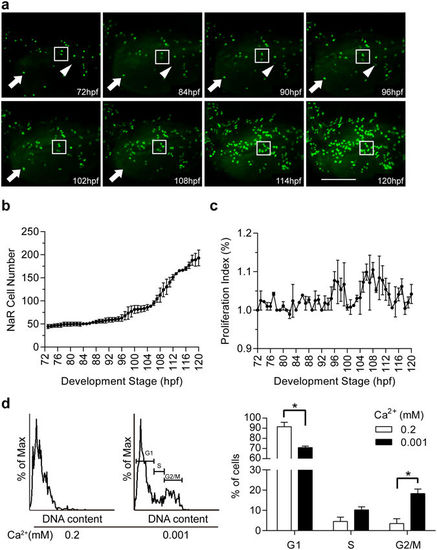
Dynamics of low [Ca2+]-induced NaR cell proliferation. Tg(igfbp5a:GFP) larvae (72 hpf) were transferred to the embryo rearing solution containing 0.001 mM [Ca2+]. Images were recorded from the same individual hourly and NaR cells numbers were determined. (a) Representative images at the indicated time points. The box shows two GFP-expressing NaR cells going through two divisions. The arrow indicates a NaR cell disappearing between 102–108 hpf. The arrowhead indicates the appearance of a new GFP-expressing cell around 86–90 hpf. (b) Average NaR cell number at the indicated time points. Values are mean ± SEM, n = 2. (c) NaR cell proliferation index at the indicated time periods. NaR cell proliferation index (%) = [(Nt − Nt−1)/Nt−1] * 100. Nt is the NaR cell number at the time of interest. Nt−1 is the NaR cell number an hour earlier. (d) Cell cycle analysis results. Left panel is a representative cell cycle histogram. Quantitative results are shown in the right panel. Values shown are mean ± SEM, n = 3, *p < 0.05. |
|
ZFIN is incorporating published figure images and captions as part of an ongoing project. Figures from some publications have not yet been curated, or are not available for display because of copyright restrictions. PHENOTYPE:
|
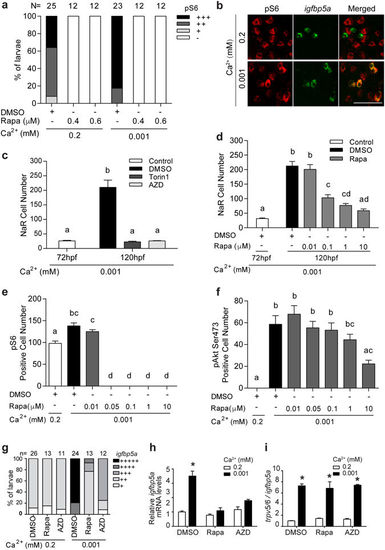
Activation of Tor signaling in NaR cells is required for their proliferation under low [Ca2+] stress. (a) Low [Ca2+] stress increases Tor signaling. 72 hpf wild type larvae were transferred to the indicated solutions. After 24 hours, they were stained using a pS6 antibody, and the results were quantified following the score system shown in Supplemental Fig. S7a. The total numbers of larvae are shown on the top of each column. (b) Low [Ca2+] activates Tor signaling in NaR cells. Larvae described in (a) were analyzed by pS6 immunostaining (red, left panel) and in situ hybridization for igfbp5a mRNA expression (green, middle panel). Merged views are shown in the right panel. (c) Tor inhibition abolishes NaR cell proliferation under low [Ca2+] stress. 72 hpf Tg(igfbp5a:GFP) larvae were treated and analyzed as described in Fig. 6. Inhibitors used are Torin1 (1 μM) and AZD8055 (AZD, 1.25 μM). (d) Dose-dependent effects of rapamycin (Rapa). Data shown are mean ± SEM, n = 10–13. Different letters indicate statistically significant differences at p < 0.05. (e,f) Different effects of rapamycin on Tor and pAkt signaling. Wild type larvae (72 hpf) were transferred to 0.2 mM or 0.001 mM [Ca2+] embryo rearing solution containing the indicated doses of rapamycin. 24 hours later, they were stained using anti pS6 (e) or pAkt antibodies (f). Values shown in (b–f) are mean ± SEM. Different letters indicate significant differences at p < 0.05, n = 10–15. (g–i) Inhibition of Tor signaling abolishes NaR cell proliferation (g) and igfbp5a mRNA expression (h) but not trpv5/6 mRNA expression (i). Wild type larvae (72 hpf) were transferred to 0.2 mM or 0.001 mM [Ca2+] embryo rearing solution containing DMSO, rapamycin (0.6 μM) or AZD8055 (1 μM), and raised to 120 hpf. NaR cells were labeled by in situ hybridization for igfbp5a mRNA and scored according to a published scoring system25. The total numbers of larvae analyzed are shown on the top. The mRNA levels of igfbp5a (h) and trpv5/6 (i) were measured by qPCR and normalized by the β-actin and igfbp5a mRNA levels, respectively. Values shown are mean ± SEM, n = 3. *p < 0.001 compared with the corresponding normal [Ca2+] control group. |
|
ZFIN is incorporating published figure images and captions as part of an ongoing project. Figures from some publications have not yet been curated, or are not available for display because of copyright restrictions. EXPRESSION / LABELING:
PHENOTYPE:
|

Generation of Tg(igfbp5a:GFP) transgenic fish using Tol2-mediated BAC transgenesis. a) Schematic diagram of the BAC(igfbp5a:GFP) construct engineered. Filled boxes indicate igfbp5a ORF and open boxes indicate UTR. The iTol2 cassette and GFP reporter gene cassette were introduced into DKEYP-56B7 by homologous recombination. The igfbp5a sequence from the start codon to the end of first exon was replaced by the GFP cassette. b) The indicated DNA was subjected to Sal I digestion. Arrows showed the different bands after recombineering. c) PCR validation of the GFP cassette insertion. Forward and reverse primers were designed to target the 5'UTR of igfbp5a and the GFP gene protein coding sequence (upper panel). PCR result is shown in the lower panel. d) Representative view of GFP expression in BAC(igfbp5a:GFP)-injected F0 larvae at 120 hpf. |

The GFP-positive cells are NaR cells. a) GFP-positive cells express trpv5/6 mRNA. Tg(igfbp5a:GFP) raised in normal [Ca2+] medium were sampled at 120 hpf and analyzed by in situ hybridization for trpv5/6 mRNA expression (green, left panels) and GFP immunostaining (red, middle panel). Merged view is shown in the right panel. Scale bar = 50 μm. b-c) The igfbp5a mRNA (b) and trpv5/6 mRNA (c) is highly expressed in GFP-positive cells . Tg(igfbp5a:GFP) larvae (72 hpf) were transferred to 0.2 or 0.001 mM [Ca2+] medium. 18h later, GFP-positive cells were isolated by FACS as described in Materials and Methods. The levels of igfbp5a and trpv5/6 mRNA were determined by qPCR and normalized by the 18s mRNA levels. Values are mean ± SEM of two independent experiments. GFP+ and GFP- indicates GFP positive- and GFP-negative cells. EXPRESSION / LABELING:
|

a) Four different levels of pS6 signal were observed in zebrafish larvae and used for quantification. b) Torin1 treatment abolishes low [Ca2+]-induced pAkt signaling. 72 hpf wild type larvae were transferred to 0.2 or 0.001 mM [Ca2+] solution containing DMSO or Torin1 (1μM). After 8h, they were subjected to immunostaining using an anti-phospho-Akt (S473) antibody. Data shown are mean ± SEM. n = 14-16. Different letters indicate 75 significant differences at p < 0.05. c) AZD8055 treatment abolishes low [Ca2+]-induced pAkt signaling. AZD8055 (1 μM) and rapamycin (10 μM) were used. Representative images are shown. |