
- Title
-
Distinct Roles for Matrix Metalloproteinases 2 and 9 in Embryonic Hematopoietic Stem Cell Emergence, Migration, and Niche Colonization
- Authors
- Theodore, L.N., Hagedorn, E.J., Cortes, M., Natsuhara, K., Liu, S.Y., Perlin, J.R., Yang, S., Daily, M.L., Zon, L.I., North, T.E.
- Source
- Full text @ Stem Cell Reports
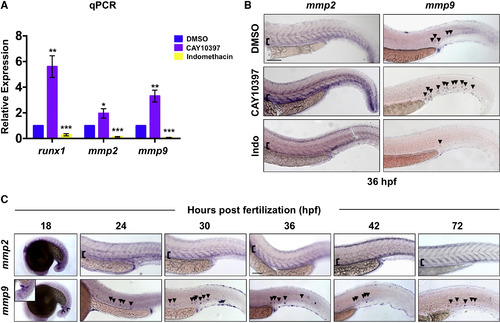
Inflammatory Activity Regulates Mmp2 and Mmp9 Expression in the VDA (B) CAY10397 (12–36 hpf) increased mmp2 and mmp9 expression, while indomethacin (Indo) diminished expression by WISH (n ≥ 20/condition). (C) WISH time course (18–72 hpf) for mmp2 and mmp9 expression (n value as in B). Arrowheads mark mmp9+ cells; brackets mark dorsal/ventral boundaries of the VDA and CV. Scale bars, 100 μm. EXPRESSION / LABELING:
|
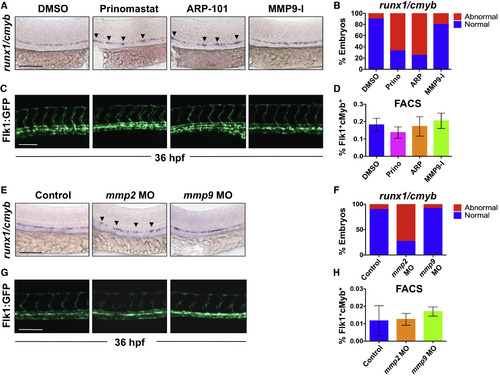
Inhibition of Mmp2, but Not Mmp9, Function Affects EHT in the VDA (A) Exposure to prinomastat (20 μM) or ARP-101 (10 μM; 12–36 hpf) caused abnormal runx1/cmyb patterning in the VDA, while MMP9-I (5 μM) had no effect. (B) Qualitative phenotypic distribution of embryos from (A) scored with normal or abnormal runx1/cmyb expression (n ≥ 20/condition). (C) In vivo imaging of Flk1:GFP at 36 hpf indicated that MMP inhibitor (12–36 hpf) treatment did not affect physical vasculature structure (n ≥ 5 embryos/condition). (D) FACS analysis of double-positive HSPCs in Tg(kdrl:dsred/cmyb:gfp) embryos showed no difference in HSPCs after MMP inhibitor exposure (12–36 hpf; 5 embryos/sample, ≥3 replicates/condition). (E) MO knockdown of mmp2 or mmp9 phenocopied effects of chemical inhibition on runx1/cmyb WISH at 36 hpf. (F) Phenotypic distribution of embryos from (E) scored for runx1/cmyb expression (as in A) in the AGM (n value as in B). (G) MO knockdown of mmp2 or mmp9 had no impact on Flk1:GFP+ endothelium (n value as in C). (H) FACS analysis of Flk1:dsRed+/cMyb:GFP+ HSPCs showed no significant difference between mmp2 or mmp9 morphants and controls at 36 hpf (n value as in D). Arrowheads mark HSPC clusters. Error bars denote mean ± SD. Scale bars, 100 μm. |
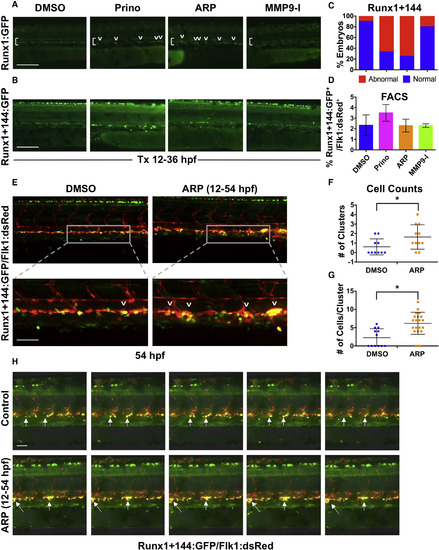
Mmp2 Inhibition Causes Abnormal HSPC Accumulation in the VDA (A) In vivo imaging for Runx1:GFP confirmed altered HSPC development in the VDA with Prinomastat (20 μM) and ARP (10 μM) (12–36 hpf; n ≥ 20 embryos/condition). (B) In vivo imaging for Runx1+144:GFP phenocopied effects seen in 3A. (C) Qualitative phenotypic distribution of embryos from (B) scored with normal or abnormal Runx1+144:GFP expression in the VDA at 36 hpf (n value as in A). (D) FACS analysis of Runx1+144:GFP+/Flk:dsRed+ HSPCs showed no significant difference with MMP inhibitor exposure (12–36 hpf; 5 embryos/sample, ≥3 replicates/condition). (E) Representative confocal images of Tg(runx1+23(144−378):egfp/kdrl:dsred) embryos, showing: (top) double-positive HSPC clusters in the VDA with ARP treatment (12–54 hpf) compared with control; (bottom) high magnification of a select cluster (n > 10 embryos/condition). (F) Absolute counts of Runx1+144+/Flk+ HSPC clusters (of >3 cells) in the VDA in embryos from (E) showed a significant increase in total clusters after ARP treatment (n > 10 embryos/condition; ∗p < 0.05). (G) Absolute counts of Runx1+144+/Flk1+ HSPC clusters (of >3 cells) in the VDA in embryos from (E) showed a significant increase in cells per cluster with ARP treatment (n > 10 embryos/condition; ∗p < 0.05). (H) Still images from the time-lapse analysis (2:45–3:10 min time stamp; see Movies S3 and S4) showed altered budding and egress of Runx1+144+Flk1+ HSPCs in the presence of ARP exposure (12–54 hpf; 2 replicates/condition) compared with controls. Arrows mark HSPC clusters; brackets mark dorsal/ventral boundaries of the VDA and CV. Error bars denote mean ± SD. Scale bars, 100 μm (A and B) and 50 μm (E and H). |
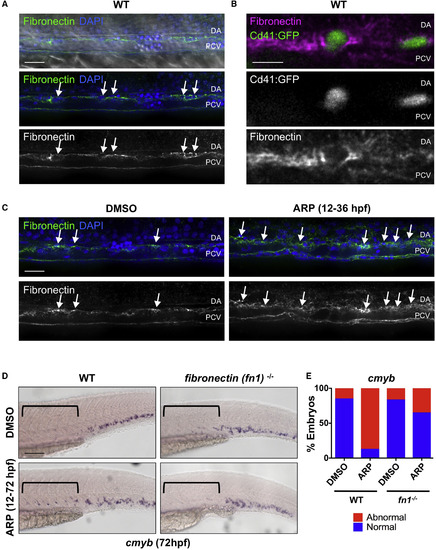
Mmp2 Facilitates HSPC Budding and Migration via Extracellular Matrix Digestion (A) Confocal images show fibronectin-rich ECM in the VDA (31 hpf): α-fibronectin antibody, green; DAPI (nuclei) staining, blue. Arrows point to cells between the dorsal aorta (DA) and posterior cardinal vein (PCV). (B) High-magnification imaging of Tg(itga2b:gfp) embryos at 48 hpf shows Cd41:GFP+ HSPCs embedded in fibronectin-rich ECM between the DA and PCV. (C) ARP (10 μM) treatment (12–36 hpf) increased fibronectin staining in the AGM (right) compared with controls at 36 hpf (left) (n ≥ 10 embryos/condition). Arrows mark areas of high fibronectin staining. (D) ARP exposure (12–72 hpf) caused sustained cmyb AGM expression in WT siblings, not in fibronectin (fn1−/−) mutants at 72 hpf. Brackets mark anterior/posterior extent of AGM region. (E) Qualitative phenotypic distribution of embryos from (D) scored for presence or absence of cmyb in the AGM at 72 hpf (n ≥ 20/condition). WT, wild-type. Scale bars, 20 μm (A), 10 μm (B), 30 μm (C), and 100 μm (D). EXPRESSION / LABELING:
PHENOTYPE:
|
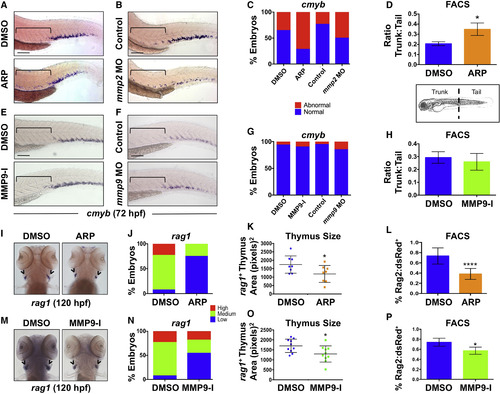
Gelatinases Play Distinct Roles in HSPC Colonization of the CHT and Thymus (A) ARP exposure (12–72 hpf) caused abnormal cmyb expression in the AGM. Brackets mark anterior/posterior extent of AGM region. (B) mmp2 morphants phenocopied the effect shown in (A) at 72 hpf. (C) Qualitative phenotypic distribution of embryos from (A) and (B) scored for abnormal retention of cmyb+ HSPCs in the AGM at 72 hpf (n ≥ 20 embryos/condition). (D) FACS analysis of Flk1:dsRed+/cMyb:GFP+ HSPCs showed a significant enrichment in the ratio of trunk to tail HSPCs in ARP-exposed embryos at 72 hpf (10 embryo sections/sample, 5 replicates/condition; ∗p < 0.05). (E) MMP9-I exposure (5 μM, 12–72 hpf) did not cause maintenance of cmyb AGM expression at 72 hpf. (F) mmp9 morphants had normal levels of cmyb in the AGM at 72 hpf. (G) Qualitative phenotypic distribution of embryos from (E) and (F) scored for cmyb+ HSPCs in the AGM at 72 hpf (n value and scoring as in C). (H) FACS analysis of Flk1:dsRed+/cMyb:GFP+ HSPCs showed no change in the trunk-to-tail ratio of HSPCs in MMP9-I-treated embryos at 72 hpf (10 embryo sections/sample, 5 replicates/condition). (I) ARP exposure from 12 to 120 hpf decreased thymic rag1+ expression. (J) Qualitative phenotypic distribution of embryos from (I) scored with low, medium, or high thymic rag1+ expression at 120 hpf (n ≥ 20/condition). (K) ImageJ measurement of rag1+ thymus area revealed a significant decrease in thymus size with Mmp2 inhibition (12–120 hpf) (n = 8/condition; ∗p < 0.05). (L) FACS for Rag2:dsRed+ lymphoid progenitors showed a significant decrease with Mmp2 inhibition (12–120 hpf) (5 embryos/sample, >3 replicates/condition; ∗∗∗∗p < 0.0001). (M) MMP9-I exposure from 12 to 120 hpf decreased thymic rag1+ expression. (N) Qualitative phenotypic distribution of embryos from (M) scored for rag1 expression in the thymus at 120 hpf (n value and scoring as in J). (O) ImageJ measurement of rag1+ thymus area revealed a significant decrease in thymus size with Mmp9 inhibition (12–120 hpf) (n = 10/condition; ∗p < 0.05). (P) FACS for Rag2:dsRed+ lymphoid progenitors showed a significant decrease with Mmp9 inhibition (12–120 hpf) (5 embryos/sample, >3 replicates/condition; ∗p < 0.05). Arrowheads in (I and M) mark paired thymii. Error bars denote mean ± SD. Scale bars, 100 μm. EXPRESSION / LABELING:
PHENOTYPE:
|
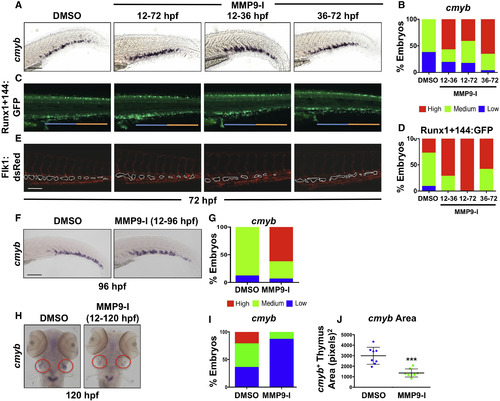
Mmp9 Inhibition Alters the Structure and Colonization of the CHT Niche (A) MMP9-I treatment during discrete intervals (12–72, 12–36, or 36–72 hpf) each increased CHT cmyb expression at 72 hpf by WISH compared with controls. (B) Qualitative phenotypic distribution of embryos from (A) scored with low, medium, or high cmyb expression in the CHT (n ≥ 20/condition). (C) MMP9-I exposure from 12–72, 12–36, or 36–72 hpf increased appearance of Runx1+144:GFP+ cells in the CHT; early treatment (12 hpf+) favored seeding of the anterior half of the CHT (blue bar) compared with the posterior (orange bar). (D) Qualitative phenotypic distribution of embryos from (C) scored with low, medium, or high overall Runx1+144:GFP expression in the CHT at 72 hpf (n ≥ 20/condition). (E) In vivo imaging of Flk1:dsRed+ showed hypovascularization of the CHT after early-onset (12 hpf+) MMP9-I exposure (n ≥ 10/condition), but not with late initiation. (F) MMP9-I treatment (12–96 hpf) retains cmyb+ HSPCs in the CHT (n ≥ 20/condition). (G) Qualitative phenotypic distribution of embryos from (F) scored for cmyb expression in the CHT at 96 hpf (n value and scoring as in A). (H) MMP9-I exposure (12–120 hpf) diminishes cmyb+ HSPC seeding the thymus (n ≥ 20/condition). Circles (red) highlight paired thymii. (I) Qualitative phenotypic distribution of embryos from (H) scored for cmyb expression in the thymus at 120 hpf (n value and scoring as in A). (J) ImageJ analysis showed significant decrease in cmyb+ thymic area after MMP9-I exposure (12–120 hpf; ∗∗∗p < 0.001). Error bars denote mean ± SD. Scale bars, 100 μm. EXPRESSION / LABELING:
PHENOTYPE:
|
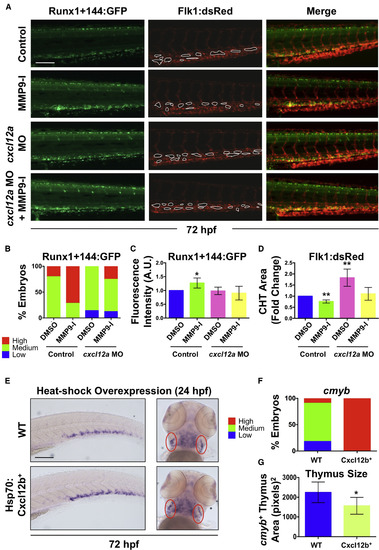
Mmp9 Affects HSPC CHT Homeostasis via Regulation of Cxcl12 Signaling (A) Knockdown of cxcl12a in Runx1+144:GFP+/Flk1:dsRed+ embryos blocked the effect of MMP9-I exposure (12–72 hpf) on Runx1+144:GFP localization (left); MMP9-I-associated hypovascularity was also antagonized (n ≥ 10/condition; center). Merged images are on the right. (B) Qualitative phenotypic distribution of embryos from (A) scored with low, medium, or high Runx1+144:GFP expression in the CHT at 72 hpf (n ≥ 10/condition). (C) ImageJ analysis revealed a significant increase in Runx1+144:GFP fluorescence intensity in the CHT with MMP9-I exposure alone (mean ± SEM; two-tailed t test; ∗p < 0.05; n ≥ 10/condition), but not in cxcl12a morphants. (D) ImageJ analysis of Flk1:dsRed at 72 hpf indicated that a significant decrease in vascularized CHT plexus area from MMP9-I exposure (mean of quadruplicate experiments ±SEM; two-tailed t test; ∗∗p < 0.01; n ≥ 10/condition) was alleviated in cxcl12a morphants. (E) Heat-shock (37°C, 30 min at 24 hpf) overexpression of Cxcl12b enhanced cmyb expression in the CHT (left) but decreased thymic staining (right) at 72 hpf. Ovals (red) highlight paired thymii. (F) Qualitative phenotypic distribution of embryos from (E) scored for cmyb expression in the CHT at 72 hpf (n value and scoring as in B). (G) ImageJ analysis showed decreased cmyb+ thymic area at 72 hpf after Cxcl12b overexpression (37°C, 30 min at 24 hpf; ∗p < 0.05). WT, wild-type. Error bars denote mean ± SD. Scale bars, 100 μm. EXPRESSION / LABELING:
PHENOTYPE:
|
Mmp2 and Mmp9 are expressed in discrete populations within hemogenic regions. Related to Figure 1.
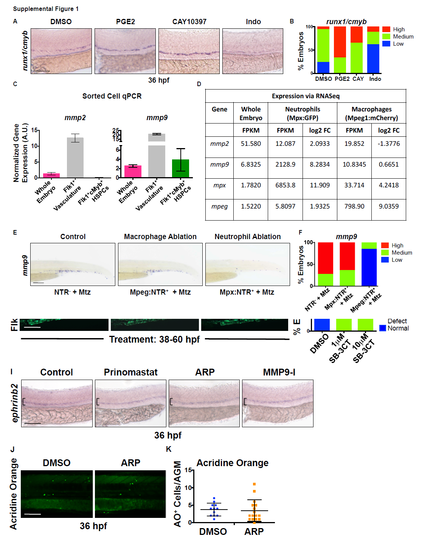
A) Exposure to dimethyl-Prostaglandin-E2 (PGE2) (10μM) and CAY10397 (CAY) (10μM), a small molecule that stabilizes endogenous PGE2, increased runx1 and cmyb expression in the ventral dorsal aorta (VDA) by WISH, while the cyclooxygenase antagonist Indomethacin (Indo, 10μM) decreased expression of HSPC markers at 36 hours post fertilization (hpf). B) Qualitative phenotypic distribution of embryos from S1A scored with high/medium/low runx1/cmyb expression in the AGM (n≥20 embryos/condition). C) qPCR analysis using FACS-sorted cell populations from Tg(kdrl:dsred;cmyb:gfp) embryos at 36 hpf showed enrichment of mmp2 in the Flk1+cMyb- vasculature, while mmp9 expression was present in all populations examined (1000 embryos x 2 replicate sorts). Error bars: mean ± SD. D) RNA-seq analysis (~1000 pooled Tg(mpeg1:mcherry;mpx:egfp) embryos, >50,000 cells/fraction) indicated that mmp9 expression is concentrated in FACS-sorted Mpx+ neutrophils at 72 hpf. E) Metronidozole (Mtz)-mediated (24-48 hpf) targeted ablation of primitive myeloid cell types in Tg(mpeg1:gal4;uas:nfsb-mcherry) (macrophage) or Tg(mpx:gal4;uas:nfsb-mcherry) (neutrophil) embryos confirmed that neutrophil loss strongly diminished mmp9 expression in the trunk and tail, while macrophage loss had minimal impact. F) Qualitative phenotypic distribution of embryos from S1E scored with high/medium/low mmp9 expression in the trunk and tail region (n≥25 embryos/condition). Scale bars: 100μm. |
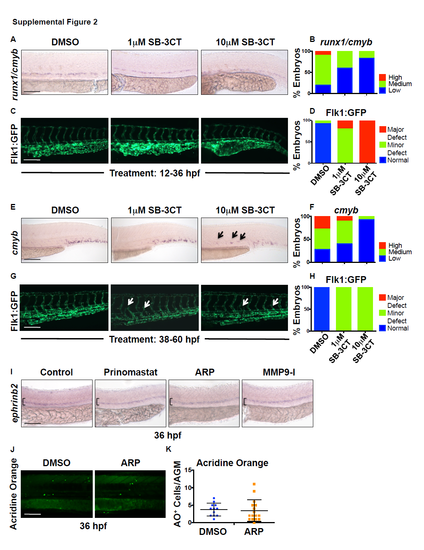
The pan-gelatinase inhibitor SB-3CT is toxic during early hematopoiesis, but ARPmediated Mmp2 inhibition has no effect on arterial identity or cell death. Related to Figure 2. A) Exposure to 10μM SB-3CT (pan-MMP2/9 inhibitor) during HSPC formation (12-36 hpf) decreased runx1/cmyb expression, while 1μM SB-3CT had no effect by WISH analysis. B) Qualitative phenotypic distribution of embryos scored with high/medium/low runx1/cmyb expression in the AGM at 36 hpf (n≥20 embryos/condition). C) High dose SB-3CT (10μM) treatment (as in S2A) caused major vascular defects and deformities in Tg(kdrl:gfp) embryos, suggestive of overall toxicity. D) Qualitative phenotypic distribution of embryos scored with normal/mild defect/major defect in Flk1:GFP expression (n≥20 embryos/condition). E) Exposure to high dose SB-3CT (10μM) at a later time point (38-60 hpf), post-HSPC specification and EHT onset, diminished cmyb expression in the CHT and caused sustained appearance in the AGM, while low dose (1μM) had less prominent impact by WISH analysis. F) Qualitative phenotypic distribution of embryos scored with high/medium/low cmyb expression in the CHT at 60 hpf (n-value as in 2B). G) Delayed onset of treatment with SB-3CT (as in S2E) led to minor vascular defects (abnormal vascular branching) in Tg(kdrl:gfp) embryos, suggesting embryos better tolerate exposure at later time points. H) Qualitative phenotypic distribution of embryos scored with normal/mild defect/major defect in Flk1:GFP expression (n-value as in 2D). I) Exposure to Prinomastat (20μM), ARP-101 (ARP, 10μM), or MMP9-I (5μM) during HSPC formation (12-36 hpf) had no effect on ephrinB2 expression in the AGM at 36 hpf by WISH analysis (n≥10/condition). J) Exposure to ARP does not alter the appearance of Acridine Orange (AO) positive (apoptotic) cells in the AGM at 36 hpf compared to controls. K) Quantification of the number of AO+ cells in the AGM region in control and ARP treated embryos (DMSO: 3.64 ±2.90; ARP: 3.25 ±2.59; p=0.61, 2-tailed t-test; n≥20 embryos/condition). Scale bars: 100μm. |
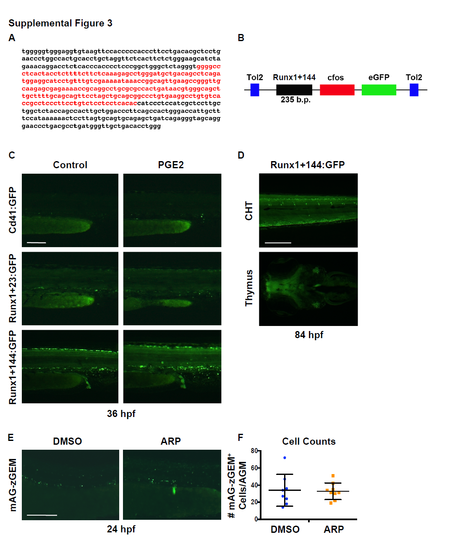
Validation of the Tg(runx1+23(144-378):egfp) HSPC reporter transgenic zebrafish line and characterization of the effect of Mmp2 inhibition on cell proliferation. Related to Figure 3. A) Genomic DNA sequence corresponding to the murine +23 Runx1 enhancer (black) and the internal 144-378 base pair fragment (Runx1+23(144-378), red). B) Schematic representation of the Runx1+144:GFP DNA construct used to create the Tg(runx1+23(144- 378):eGFP) line; a Tg(runx1+23:egfp) transgenic reporter genetically similar to the recently published Tg(runx:egfp) line (Tamplin et al., 2015) was also created using the full murine enhancer sequence. C) Representative fluorescence pattern Cd41:GFP+, Runx1+23:GFP+ and Runx1+144:GFP+ cells in the AGM of transgenic embryos at 36 hpf after treatment with dmPGE2 (10μM; 12-36 hpf) compared to DMSO controls, measured with the same length of exposure time. D) Representative images of Runx1+144:GFP expression in the CHT (top) and thymus (bottom) at 84 hpf. E) Exposure to ARP-101 (ARP, 10μM) from 12-24 hpf does not impact the appearance of proliferating cells in the AGM of Tg(EF1:mAG-zGEM(1/100); kdrl:dsred) embryos compared to controls at 24 hpf. F) Quantification of the number of mAG-zGEM (G2/M)+ cells in the AGM of embryos from S3E (DMSO: 34.0 ±18.6; MMP9-I: 32.8 ±9.64, p=0.865, 2-tailed t-test, n≥7 embryos/condition). Error bars: mean ± SD. Scale bars: 100μm. |
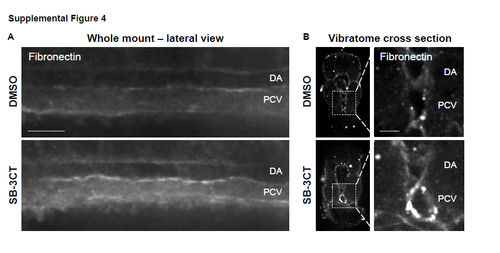
Mmp2 inhibition causes an accumulation of fibronectin in the AGM. Related to Figure 4. A) Exposure to SB-3CT (10μM, 32-48 hpf) increased fibronectin staining in the AGM compared to controls at 48 hpf (n≥10 embryos/condition). B) Vibratome cross-sections show increased fibronectin staining in the posterior cardinal vein (PCV) and ventral wall of the dorsal aorta (DA) with SB-3CT treatment (32-54 hpf) compared to controls; inset magnifications of boxed regions (from left panels) show gray-scale fluorescence of fibronectin (right; n≥7 embryos/condition). Scale bars: 30 (A) and 15μm (B). |
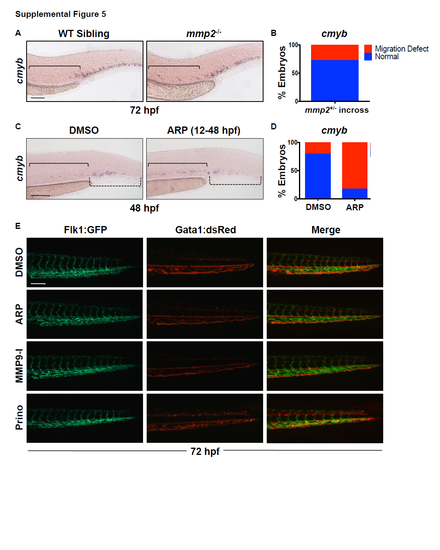
Mmp2 inhibition delays HSPC migration to the CHT without impacting circulation. Related to Figure 5. A) mmp2 mutants display inappropriate cmyb expression in the AGM at 72 hpf, phenocopying the effect of ARP- and MO-mediated Mmp2 inhibition. B) Qualitative phenotypic distribution of total embryos from S5A (mmp2+/- incross) scored with normal versus abnormal cmyb expression in the AGM at 72 hpf (n≥20 embryos/condition). C) Embryos exposed to ARP (10μM, 12-48 hpf) showed reduced cmyb expression in the CHT, concurrent with enhanced expression in the AGM at 48 hpf, suggesting HSPCs are restrained in colonization of secondary hematopoietic sites with loss of Mmp2 function. D) Qualitative phenotypic distribution of embryos from S5C scored with normal versus abnormal cmyb expression at 48 hpf (n≥20 embryos/condition). E) In vivo imaging of Tg(kdrl:gfp/gata1a:dsred) embryos after exposure (12-72 hpf) to ARP, MMP9-I or Prinomastat showed no differences in Gata1+ erythrocyte circulation through the Flk1+ CHT vasculature compared to controls at 72 hpf (n≥10 embryos/condition). Scale bars: 100μm. |
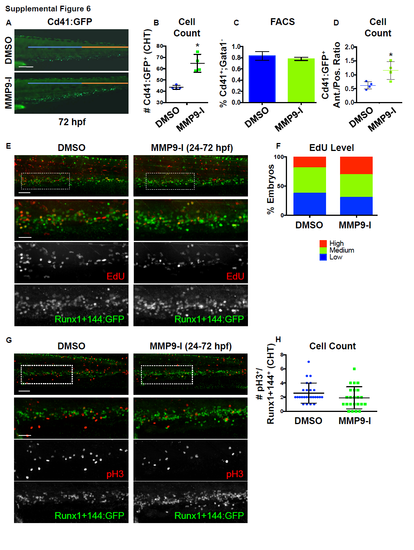
Mmp9 inhibition impacts HSPC localization and number in the CHT, independent of alterations in cell proliferation. Related to Figure 6.
A) In vivo imaging of Tg(-6.0itga2b:egfp) embryos showed MMP9-I treatment (5μM,12-72 hpf) increased the appearance of Cd41+ HSPCs in the CHT region, including preferential accumulation in the anterior (blue bar) versus posterior (orange bar) half of the hematopoietic niche. B) Quantification of the phenotype shown in S6A via manual counts of the number of Cd41:GFP+ cells per entire CHT region (DMSO: 43.5 ±1.73; MMP9-I: 64.75 ±7.93, *p<0.05, 2-tailed t-test, n≥4 embryos/condition). Error bars: mean ± SD. C) FACS for Cd41:GFP+,Gata1:dsRed- cells (with negative thrombocyte selection) showed no difference in whole embryo HSPC numbers at 72 hpf with MMP9-I exposure (12-72 hpf) compared to control (DMSO: 0.83 ±0.077; MMP9-I: 0.781 ±0.028, p=0.328, 2-tailed t-test, n≥5 embryos/sample, >3 replicates/condition). Error bars: mean ± SD. D) Quantification of the localization phenotype observed in S6A via manual count Cd41:GFP+ HSPCs in each half of the CHT at 72 hpf revealed an increase in the anterior: posterior cell number ratio with Mmp9 (12-72 hpf) inhibition (DMSO: 0.62 ±0.132; MMP9-I: 1.16 ±0.317, *p<0.05, 2-tailed t-test, nvalue as in S6B). Error bars: mean ± SD. E) EdU labeling in Tg(runx1+23(144-235):egfp) embryos showed no change in the level of double positive EdU/Runx1+144 staining in the CHT after MMP9-I treatment (24-72 hpf). F) Qualitative phenotypic distribution of total embryos from S6E scored with high, medium, or low EdU staining level at 72 hpf (n≥20 embryos/condition). G) pH3 staining in Tg(runx1+23(144-235):egfp) embryos showed no alteration in the number of double positive pH3/Runx1+144 cells in the CHT after MMP9-I treatment (24-72 hpf). H) Quantification of the phenotype in S6G via manual counts of the number of pH3+/Runx1+144:GFP+ HSPCs per CHT in control and MMP9-I treated embryos (DMSO: 2.58 ±1.42; MMP9-I: 1.91 ±1.56; p=0.13, 2-tailed t-test; n≥20 embryos/condition). Error bars: mean ± SD. Scale bars: 100μm. |
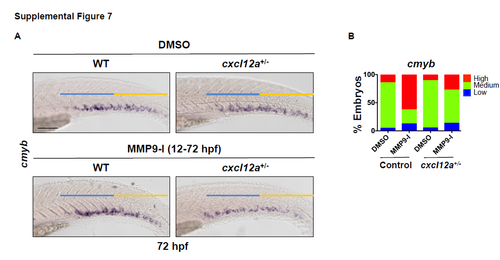
Mmp9 inhibition does not impact HSPC localization in cxcl12a heterozygous mutants. Related to Figure 7. A) Exposure of wild-type (WT) sibling controls to MMP9-I (5μM, 12-72 hpf) increased cmyb expression in the CHT at 72 hpf; in contrast, while heterozygous loss of cxcl12a in cxcl12at30516/t30516 (cxcl12a+/-) embryos had no impact on cmyb expression alone, it antagonized the effect of Mmp9 inhibition (n≥20/condition). B) Qualitative phenotypic distribution of control and MMP9-I treated WT and cxcl12a+/- siblings from S7A scored with high/medium/low cmyb expression at 72 hpf (n≥20/condition). Scale bars: 100μm. |