
- Title
-
Whole-Exome Sequencing of Congenital Glaucoma Patients Reveals Hypermorphic Variants in GPATCH3, a New Gene Involved in Ocular and Craniofacial Development
- Authors
- Ferre-Fernández, J.J., Aroca-Aguilar, J.D., Medina-Trillo, C., Bonet-Fernández, J.M., Méndez-Hernández, C.D., Morales-Fernández, L., Corton, M., Cabañero-Valera, M.J., Gut, M., Tonda, R., Ayuso, C., Coca-Prados, M., García-Feijoo, J., Escribano, J.
- Source
- Full text @ Sci. Rep.
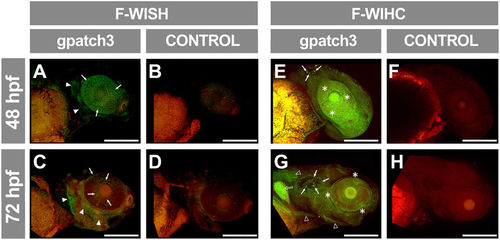
Analysis of gpatch3 expression in ocular and non-ocular embryonic tissues during early zebrafish development. (A–D) Expression analysis by fluorescent-whole mount in situ hybridization (F-WISH) of gpatch3 in zebrafish embryos at 48 (A and B) or 72 (C and D) hpf with Alexa Fluor-488 labelled gpatch3 antisense RNA probes (A and C) or sense RNA probes as a control (B and D). The green channel corresponds to gpatch3 expression and the red channel to tissue autofluorescence. The arrows and arrowheads indicate gpatch3 expression in the developing anterior segment and head dermis, respectively. Scale bars represent 200 μm. (E–H) Immunodetection by fluorescent-whole mount immunohistochemistry (F-WIHC) of Gpatch3 in zebrafish embryos at 48 (E and F) or 72 hpf (G and H) using rabbit anti-GPATCH3 primary antibody and Cy2 donkey anti-rabbit secondary antibody (E and G) or only secondary antibody (F and H) as a negative control. The green channel corresponds to Gpatch3 expression and the red channel to tissue autofluorescence. Arrows, empty arrowheads, empty arrow and asterisks indicate Gpatch3 expression in the otic vesicle, muscles, pectoral fin and developing anterior segment, respectively. Scale bars represent 200 μm. EXPRESSION / LABELING:
|
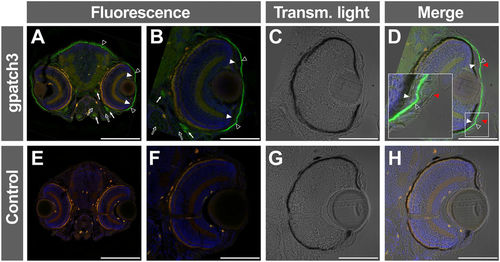
Immunohistological detection of Gpatch3 in transverse head sections of zebrafish embryos. (A–D) Expression of gpatch3 was analyzed in 10 μm cryostat sections of fixed zebrafish embryos at 96 hpf by fluorescent immunohistochemistry with a rabbit anti-GPATCH3 primary antibody and a Cy2 donkey anti-rabbit secondary antibody. The green channel corresponds to Gpatch3, the red channel to tissue autofluorescence and the blue channel to DAPI nuclear staining. The arrows indicate mandibular and periocular muscles, the empty arrows indicate jaw cartilages, the white arrowheads indicate periocular mesenchyme, the empty arrowheads indicate corneal endothelium and dermis and the red arrowheads show the corneal epithelium. (C and G) Transmitted light microscopy of panels B and F, respectively. (E–H) Embryos hybridized with only secondary antibody were used as a negative control. Scale bars represent 200 μm in panels A and E and 100 μm in panels (B–D and F–H). EXPRESSION / LABELING:
|

Analysis of gpatch3 knock-down-associated phenotypes in zebrafish morphant embryos. Gpatch3ATG MO-injected zebrafish embryos were analyzed at 96 hpf, and four phenotypes (Ph-1-4) with increasing severity were described. Lateral and ventral brightfield micrographs show altered phenotypes including microphthalmia (blue arrowheads), mouth and branchial arches (red arrowheads) and pectoral fins (green arrowheads) maldevelopment and pericardial (black arrowheads) and periocular (empty arrowheads) edemas. Scale bars represent 200 μm. PHENOTYPE:
|

Analysis of gpatch3 knock-down-associated phenotypes in histological transverse sections of zebrafish gpatch3 morphants. Gpatch3ATG MO-injected zebrafish embryos were analyzed at 96 hpf and four phenotypes (Ph-1-4) with increasing severity were described. The 100X and 400X brightfield micrographs of 10 μm cryostat transverse head sections stained with hematoxilin and eosin show altered phenotypes including microphthalmia, mandibular maldevelopment (asterisks), enlarged intracranial and periocular spaces (empty arrowheads) and iridocorneal angle defects (empty arrows). Scale bars represent 100 μm in head section panels and 20 μm in iridocorneal angle magnification panels. Xa: xantophores. Ir: iridophores. M: periocular mesenchyme. PHENOTYPE:
|

Analysis of gpatch3 overexpression-associated phenotypes in zebrafish embryos. Gpatch3 mRNA microinjected zebrafish embryos were analyzed at 96 hpf and two phenotypes (Ph-A- and Ph-B) with increasing severity were described. Lateral and ventral brightfield micrographs show altered phenotypes including microphthalmia (blue arrowheads), pectoral fins maldevelopment (green arrowheads) and periocular (red arrowheads) and pericardial (black arrowheads) edemas. Scale bars represent 200 μm. PHENOTYPE:
|
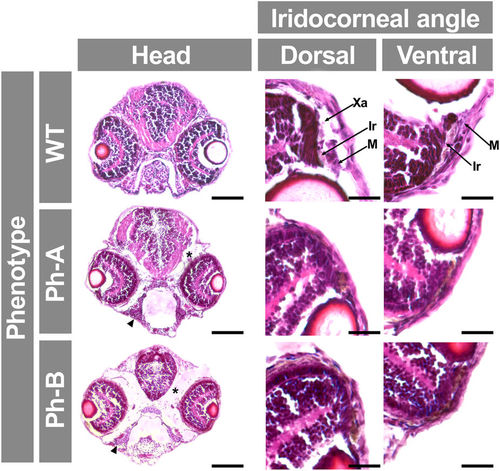
Analysis of gpatch3 overexpression-associated phenotypes in histological transverse sections of zebrafish. Gpatch3 mRNA microinjected zebrafish embryos were analyzed at 96 hpf and two phenotypes (Ph-A and Ph-B) with increasing severity were described. Brightfield micrographs of 10 μm cryostat transverse head sections stained with hematoxilin and eosin show altered phenotypes including microphthalmia, iridocorneal angle defects, periocular and intracraneal edemas (asterisks) and underdevelopment of pharyngeal cartilages (arrowhead). Scale bars represent 100 μm in head section panels and 20 μm in iridocorneal angle magnification panels. Xa: xantophores. Ir: iridophores. M: periocular mesenchyme. |

Zebrafish gpatch3 morphants present similar gross morphological alterations with three different morpholinos. Control, Gpatch3ATG, Gpatch3ex1/2 and Gpatch3ex2/3 MOs (2.0 ng) were microinjected in 1-2 cells zebrafish embryos. The standard negative control consisted of a MO that targets a human beta-globin intron mutation that causes beta-thalassemia. At 72 hours post fecundation (hpf), larvae were analyzed. Dorsal, lateral and ventral dark field micrographs show altered phenotypes including microphthalmia (blue arrowheads) and abnormal development of pectoral fins (green arrowheads) and craniofacial structures including absence of jaw cartilages (red arrowheads). Scale bars indicate 200 μm. PHENOTYPE:
|

Alcian blue cartilage staining in Gpatch3ATG morphants at 96 hpf. cbs, ceratobranchials; ch, ceratohyal, m, Meckel’s cartilage; ep, ethmoid plate; hs, hyosymplectic; pc, parachordal; pq, palatoquadrate; tr, trabecula. Scale bars represent 200 μm. PHENOTYPE:
|

Characterization of jaw cartilague maldevelopment of Gpatch3ATG morphants at 96 hpf. Reporter Tg(sox10:GFP) zebrafish embryos were microinjected with 2.0 ng of the gpatch3ATG MO. Merge of the maximum intensity projection of fluorescent signals (sox10:GFP) and transmitted light micrographs is also shown. cbs, ceratobranchials; ch, ceratohyal, m, Meckel’s cartilage; ep, ethmoid plate; pq, palatoquadrate; op, olfactory pit; pf, pectoral fin. Scale bars represent 200 μm. |