
- Title
-
Flow-Dependent Endothelial YAP Regulation Contributes to Vessel Maintenance
- Authors
- Nakajima, H., Yamamoto, K., Agarwala, S., Terai, K., Fukui, H., Fukuhara, S., Ando, K., Miyazaki, T., Yokota, Y., Schmelzer, E., Belting, H.G., Affolter, M., Lecaudey, V., Mochizuki, N.
- Source
- Full text @ Dev. Cell
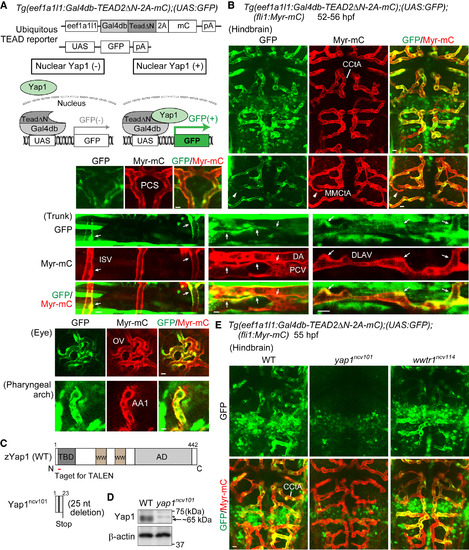
Monitoring Transcriptional Activity of Yap1 Indirectly in Endothelial Cells of Living Zebrafish (A) (Upper) The constructs used to monitor Yap1 responses ubiquitously by eef1a1l1 promoter (ubiquitous TEAD reporter). (Lower) Schematic illustration explains how the system works. In this Tg system, a fusion protein containing Gal4db-TEAD2ΔN, 2A peptide, and mCherry (mC) was ubiquitously expressed under the control of eef1a1l1 promoter. Gal4db-TEAD2ΔN is a Gal4 driver, in which a truncated form of human TEAD2 lacking the DNA-binding domain (TEAD2ΔN) is fused to the DNA-binding domain of Gal4 (Gal4db), whereas UAS-GFP is a responder transgene, in which GFP gene was placed downstream of UAS, the Gal4 recognition sequence. Upon nuclear translocation of Yap1, it binds to Gal4db-TEAD2ΔN in the nucleus, thereby inducing GFP expression via the Gal4-UAS system. This reporter reflects the interaction between endogenous Yap1 (or Wwtr1) and exogenously expressed Gal4db-TEAD2ΔN in the nucleus. pA, polyadenylation signal; UAS, upstream activation sequence. (B) Projection view of confocal stack fluorescence images of Tg(eef1a1l1:Gal4db-TEAD2ΔN-2A-mC);(UAS:GFP);(fli1:Myr-mC) embryos (52–56 hr post fertilization [hpf]). Images of hindbrain. Dorsal view, anterior to the top. Images of trunk, eye, and pharyngeal arch. Lateral view, anterior to the left. GFP images (green), mC images (red), and the merged images are shown. Arrows indicate GFP signal-positive ECs of lumenized blood vessels. Arrowheads indicate a vessel sprout showing GFP signals. (C) Schematic illustration of wild-type (WT) Yap1 and truncated Yap1ncv101 resulting from 25 nucleotides deletion in the exon1 of yap1ncv101 allele. TBD, TEAD-binding domain; WW, WW domain; AD, transcriptional activation domain. (D) Lysates from WT and homozygous yap1ncv101 mutant embryos were subjected to western blot analyses with anti-Yap1 and anti-β-actin antibodies. Arrow indicates Yap1. Asterisk indicates non-specific band. (E) Projection view of confocal stack fluorescence images of the hindbrain in Tg(eef1a1l1:Gal4db-TEAD2ΔN-2A-mC);(UAS:GFP);(fli1:Myr-mC) WT (left), homozygous yap1ncv101 mutant (middle), and wwtr1ncv114 mutant (right) embryos at 55 hpf. Upper panels, GFP images (green); lower panels, merged images (GFP, green; Myr-mC, red). Representative images of three independent experiments are shown. CCtA, cerebellar central artery; MMCtA, middle mesencephalic central artery; PCS, posterior communicating segment; ISV, intersomitic vessel; DA, dorsal aorta; PCV, posterior cardinal vein; DLAV, dorsal longitudinal anastomotic vessel; OV, optic vessel; AA1, mandibular arch. Scale bars, 10 μm. See also Figure S1; Movies S1 and S2. EXPRESSION / LABELING:
PHENOTYPE:
|

Yap1/TEAD-Dependent Transcription Becomes Active in Perfused Vessels (A) The constructs used to monitor Yap1 responses in EC by using fli1 promoter (EC-specific TEAD reporter). (B) Projection view of confocal stack fluorescence images of the trunk region in Tg(fli1:Gal4db-TEAD2ΔN-2A-mC);(UAS:GFP);(fli1:Myr-mC) WT (left) and homozygous yap1ncv101 mutant embryos (right) at 50 hpf. Lateral views, anterior to the left. Upper panels, GFP images (green); lower panels, merged images (GFP, green; Myr-mC, red). White arrows indicate GFP signal-positive ECs of lumenized blood vessels. Representative images of four independent experiments are shown. (C) Projection view of confocal images of the trunk region in Tg(fli1:Gal4db-TEAD2ΔN-2A-mC);(UAS:GFP);(fli1:Myr-mC) embryos (at 32 and 50 hpf as indicated at the left) injected with Qdot 655 (white) into the heart to visualize perfused vessels. Left, GFP images (green); right, merged images (Qdot 655, white; GFP, green; Myr-mC, red). While a significant population of ECs of perfused vessels expresses GFP (white arrows), ECs of non-perfused vessels do not (magenta arrows). (D) Projection view of confocal images of the trunk region of fixed Tg(fli1:EGFP-YAP) embryos (at 27–50 hpf as indicated at the top) immunostained with anti-GFP antibody (green) together with DAPI (blue). White and orange arrowheads indicate EGFP-YAP in the cytoplasm and nucleus, respectively. (E) Graph shows percentage of the number of the ECs in which EGFP-YAP is excluded from the nucleus (N < C, white bars) and those in which EGFP-YAP is localized in the nucleus (N > C or N = C, black bars) at the indicated stages of the dorsal aorta (DA) and the arterial intersomitic vessels (aISVs) among the total number of observed ECs (indicated at the top) from 7 to 10 embryos. (F) Time-sequential two-photon images of ISVs in Tg(fli1:EGFP-YAP) embryos that were about to form lumen (from 37 hpf). Elapsed time (min) is indicated at the left. Yellow asterisks indicate newly formed lumens connecting to the circulation. White and orange arrowheads indicate EGFP-YAP in the cytoplasm and nucleus, respectively. Representative images of seven independent experiments are shown. Scale bars, 10 μm. See also Figure S2.. |

Flow Induces Nuclear Translocation of YAP (A) Time-lapse confocal imaging of the onset of the circulation in the DA of Tg(fli1:EGFP-YAP);(fli1:H2B-mC) embryos (from 29 hpf). To visualize the circulation, we injected Qdot 655 (white) into the heart just before imaging. Yellow asterisks indicate lumen in the DA. Elapsed time (min) is indicated at the top. White and orange arrowheads indicate EGFP-YAP (green) in the cytoplasm and nucleus, respectively. H2B, histone H2B. (B) Percentage of ECs in the DA in which EGFP-YAP translocated from “cytoplasm to nuclei” or from “nuclei to cytoplasm” just after the circulation. Localization change was examined between 20 and 30 min before the onset of the circulation and 20–30 min after the onset of the circulation visualized by Qdot 655 as in (A). Data obtained from at least ten cells of single DA of three embryos are expressed as mean ± SD. (C) Human pulmonary artery endothelial cells (HPAECs) cultured at high density (1,000–1,500 cells/mm2) under static conditions or after laminar shear stress at 15 dynes/cm2 for 10 min were fixed and immunostained with anti-YAP antibody together with DAPI. YAP images and the merged images (YAP, green; DAPI, blue) are shown. (D) Quantification of nuclear relative to cytoplasmic fluorescent intensity of YAP in static or sheared HPAECs examined in (C). Data are mean ± SD (n = 3 independent experiments, in each of which >150 cells were measured). (E and F) HPAECs transfected with control siRNA, YAP siRNA, WWTR1 siRNA, or YAP + WWTR1 siRNAs were kept under static conditions or subjected to shear stress at 15 dynes/cm2 for 30 min. Relative expression levels of CTGF mRNA (E) and CYR61 mRNA (F) were analyzed by qPCR analyses. Data are normalized to the values in static control siRNA-transfected ECs. Data are mean ± SD (n ≥ 3 independent experiments). ∗p < 0.05, ∗∗p < 0.01, ∗∗∗p < 0.001; NS, not significant. Scale bars, 10 μm. See also Figure S3. EXPRESSION / LABELING:
|

Blood Flow Regulates Yap1 Localization (A) Time-sequential confocal images of Tg(fli1:EGFP-YAP);(fli1:H2B-mC) embryos before treatment (56 hpf) and 20 min after cessation of blood flow (BF) by nifedipine treatment. EGFP-YAP was translocated from the nucleus (orange arrowheads) to the cytoplasm (white arrowheads) after cessation of BF. (B) Graph shows percentage of the number of the ECs in which EGFP-YAP is excluded from the nucleus (N < C, white bars) and those in which EGFP-YAP is localized in the nucleus (N > C or N = C, black bars) among the total number of observed ECs (indicated at the top) in ISVs of Tg(fli1:EGFP-YAP);(fli1:H2B-mC) embryos before treatment (56 hpf) and 20–30 min after cessation of BF by nifedipine. (C) Similarly to (A), the images of the embryo before treatment, 20 min after cessation of BF by 3-butanedione monoxime (BDM) treatment, and 2 hr after restart of BF by washing out BDM. EGFP-YAP was translocated from the nucleus (orange arrowheads) to the cytoplasm (white arrowheads) after cessation of BF and relocated to the nucleus (orange arrowheads) after the restart of BF. (D) Similarly to (B), the number of the ECs having EGFP-YAP in the nucleus or cytoplasm was quantified before and after the treatment with BDM as indicated at the bottom. (E) Projection of confocal stack fluorescence images of the ISVs in Tg(fli1:Gal4db-TEAD2ΔN-2A-mC);(UAS:GFP);(fli1:Myr-mC) embryos at 56 hpf (before treatment) and 10 hr after cessation of BF by nifedipine treatment. GFP images (left) and Myr-mC images (right) are shown. To avoid the bleaching of the fluorescent protein, we performed confocal imaging at two time points (before treatment and 10 hr after) with minimum laser power using the GaAsP detector. Arrows indicate GFP-positive ECs. (F) Fluorescent intensities of GFP in individual ISVs were quantified before treatment and 10 hr after cessation of BF by nifedipine, as observed in (E). The intensity of GFP in ECs was normalized by that of mCherry (see STAR Methods). Fifteen ISVs of three embryos were analyzed. ∗∗p < 0.01. Scale bars, 10 μm. See also Figure S4. |

Angiomotins Are Involved in the Regulation of Nuclear Translocation of YAP Induced by Shear Stress (A) HPAECs transfected with EGFP or EGFP-AMOT were kept under static conditions or subjected to shear stress (15 dynes/cm2, 10 min) and immunostained with anti-YAP and anti-GFP antibodies together with DAPI. YAP images (left) and the merged images (right; EGFP, green; YAP, red; DAPI, blue) are shown. Yellow arrowheads indicate EGFP-expressing cells. (B) Quantification of nuclear fluorescence intensity of YAP relative to that of cytoplasm in EGFP- or EGFP-AMOT-expressing HPAECs as in (A) (n = 3 independent experiments, in each of which >20 EGFP-expressing cells measured). (C) HPAECs under static conditions or after shear stress were immunostained with anti-AMOT antibody and stained with rhodamine-phalloidin (F-actin). Super-resolution images (right) were acquired in the boxed regions of confocal fluorescence images (left). In the right panels, the merged images (left; AMOT, green; F-actin, red) and AMOT images (right: green) are shown. Representative images of two independent experiments are shown. (D and E) Lysates of static or sheared HPAECs were immunoprecipitated with mouse anti-YAP (D) or rabbit anti-YAP antibody (E). Coprecipitated endogenous AMOT (p130) was detected by immunoblotting with anti-AMOT antibody. Similar results were obtained in three independent experiments using each antibody. (F) Total AMOT (Input) and the AMOT and YAP immunoprecipitated with rabbit anti-YAP antibody (IP: YAP Ab) in static or sheared HPAECs as in (E) were analyzed. The relative intensity was calculated by the intensity of the band of immunoprecipitated AMOT or YAP by anti-YAP antibody in the static or sheared HPAECs (n = 3 independent experiments). (G) HPAECs transfected with control siRNA or AMOT + AMOTL1 + AMOTL2 siRNAs (AMOTs triple siRNAs) were kept under static conditions or subjected to shear stress (15 dynes/cm2, 10 min) and immunostained with anti-YAP antibody together with DAPI. (H) Quantification of nuclear fluorescence intensity of YAP relative to that of cytoplasm as in (G) (n = 3 independent experiments, in each of which >100 cells were measured). (I) A schematic representation of how YAP translocates into the nucleus in response to shear stress. In static ECs YAP is kept in the cytoplasm, at least in part by binding to AMOT. Upon shear stress, a significant population of AMOT preferentially binds to the increased levels of cortical actin bundles. By direct binding to F-actin or by other unknown mechanism, AMOT releases YAP. Released YAP then enters into the nucleus to promote TEAD-dependent transcription. (J) Projection view of confocal stack fluorescence images of the trunk region in Tg(fli1:Gal4db-TEAD2ΔN-2A-mC);(UAS:GFP);(fli1:Myr-mC) WT (left) and homozygous amotl2afu45 mutant embryos (right) at 30 hpf. Upper panels, GFP images; lower panels, merged images (GFP, green; Myr-mC, red). Arrows indicate ectopic GFP expression in the developing ISVs. Representative images of three independent experiments are shown. Data are means ± SD in (B), (F), and (H). ∗∗p < 0.01, ∗∗∗p < 0.001; NS, not significant. Scale bars, 10 μm. See also Figure S6. |
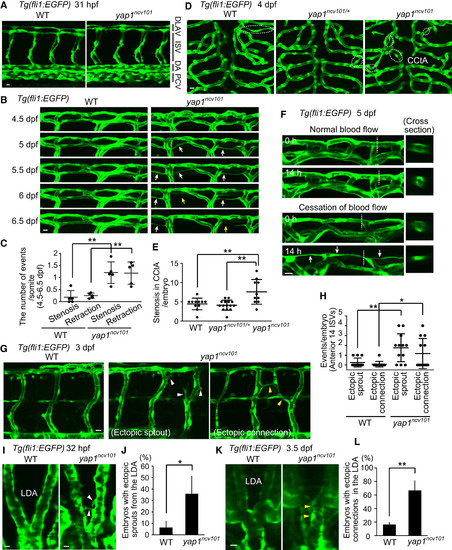
Yap1 Is Required for Vessel Maintenance (A) Projection view of confocal stack fluorescence images of Tg(fli1:EGFP) WT (left) embryos with WT allele (left) and yap1ncv101 mutant allele (right) fixed at 31 hpf. Note the overall normal vascular formation in homozygous mutants. (B) Projection view of confocal images of the DLAVs in Tg(fli1:EGFP) larvae with WT (left) and yap1ncv101 allele (right) taken every 12 hr from 4.5 dpf to 6.5 dpf. White and yellow arrows indicate blood vessels exhibiting lumen stenosis and EC retraction, respectively. (C) Quantitative analyses of incidence of the DLAVs showing lumen stenosis and EC retraction at a single somite level from 4.5 to 6.5 dpf as in (B). Each dot represents the value for an embryo. For each embryo, the number of the events at six to eight somite levels were counted and then divided by the total number of somite levels observed. Horizontal lines represent mean ± SD. (D) Projection view of confocal images of the hindbrain region in Tg(fli1:EGFP) larvae with WT allele (left), heterozygous yap1ncv101/+ allele (middle), and yap1ncv101 allele (right) at 4 dpf. Dorsal view. Dashed circles indicate lumen stenosis in the CCtA. (E) Quantification of the number of blood vessels showing lumen stenosis in the CCtA of WT, yap1ncv101/+, or yap1ncv101 larvae at 4 dpf as observed in (D). Each dot represents the number of stenoses found in an embryo. Horizontal lines represent mean ± SD (n ≥ 10 independent experiments). (F) Projection view of confocal stack fluorescence images of the DLAVs in Tg(fli1:EGFP) larvae (5 dpf) at the indicated time after cessation of blood flow by BDM treatment or without treatment. Transverse sections at the dashed lines are shown to the right. Arrows indicate blood vessels showing lumen stenosis. (G) Projection view of confocal images of the anterior trunk ISVs in Tg(fli1:EGFP) larvae with WT allele (left) and yap1ncv101 allele (right) at 3 dpf. White and yellow arrowheads indicate ISVs exhibiting ectopic sprouts and ectopic connections, respectively. (H) Quantification of the number of ectopic sprouts from the ISVs and ectopic connections in the ISVs within 14 ISVs of anterior trunk for each embryo at 3 dpf as in (G). Each dot represents the value for an embryo. Horizontal lines represent mean ± SD (n = 12 independent experiments). (I) Projection view of confocal images of the LDA in Tg(fli1:EGFP) embryos with WT allele (left) and yap1ncv101 allele (right) at 32 hpf. Dorsal view. White arrowheads indicate ectopic sprouts from the LDA. (J) Graph shows the percentage of the embryos with ectopic sprouts from the LDA at 31–32 hpf as in (I). Data are mean ± SD (n = 3 independent experiments, in each of which ≥9 embryos were measured). (K) Projection view of confocal images of the LDA in Tg(fli1:EGFP) larvae with WT allele (left) and yap1ncv101 allele (right) at 3.5 dpf. Dorsal view. Yellow arrowheads indicate ectopic connections in the LDA. (L) Graph shows the percentage of the embryos with ectopic connections in the LDA at 3.5 dpf as in (K). Data are mean ± SD (n = 3 independent experiments, in each of which >8 embryos were measured). ∗p < 0.05, ∗∗p < 0.01. Scale bars, 10 μm. See also Figure S7. |

Generation of TEAD reporter, yap1 mutant, and wwtr1 mutant zebrafish, Related to Figure 1. (A) Projection view of confocal stack fluorescence images of Tg(fli1:EGFP) (top), Tg(eef1a1l1:Gal4db-TEAD2ΔN-2A-mC);(fli1:EGFP) (middle), and Tg(eef1a1l1:Gal4db-TEAD2ΔN-2A-mC);(fli1:EGFP);(fli1:Myr-mC) (bottom) embryos at 50 hpf. Lateral views, anterior to the left, unless otherwise described. Left column, bright-field images; the second and third columns, mC images taken with different laser transmissivity of 559 nm laser indicated at the top; right column, EGFP images. While fluorescence of mC of Tg(eef1a1l1:Gal4db-TEAD2ΔN-2A-mC) was ubiquitously detected at stronger laser illumination (8.5%), it was negligibly faint compared to that of Myr-mC of Tg(fli1:Myr-mC) at weaker laser illumination (2.5%). (B) Schematic diagrams of the wild-type yap1 (WT) (upper) and mutant yap1ncv101 (lower) alleles. TALENs were designed to target exon1 of yap1. The left and right TALEN binding sites are shown in blue. The spacer region is shown in red. The yap1ncv101 allele harbors a 25 nucleotide (nt) deletion in the first exon, resulting in a premature stop codon. (C) Genotyping of single embryo sampled from WT and homozygous yap1ncv101 mutant fish. PCR analyses of genomic DNAs were performed using a primer set indicated in the left panel. The 361-bp fragment and the 336-bp fragment were PCR-amplified in the WT and yap1ncv101 embryo, respectively. (D) Schematic diagrams of the WT allele (upper) and mutant wwtr1ncv114 allele (lower) are shown similarly to (B). The wwtr1ncv114 allele harbors an 8 nucleotide (nt) deletion in the first exon, resulting in a premature stop codon. (E) Bright-field images of WT and homozygous yap1ncv101 mutant embryos at 55 hpf. Note that the yap1ncv101 mutant embryos are morphologically normal. (F) Graph shows percentage of the number of embryos showing normal circulation (Normal) and no circulation (None) in the trunk or head region of WT or homozygous yap1ncv101 mutant embryos (at 55 hpf) among the total numbers of embryos observed (indicated at the top). Note that the yap1ncv101 mutant embryos have normal circulation. (G) Stereomicroscopic images of Tg(eef1a1l1:Gal4db-TEAD2ΔN-2A-mC);(UAS:GFP) embryos (33 hpf) injected with control morpholino oligonucleotide (MO) (left) or lats1 and lats2 double MOs (right). Note that GFP expression is markedly enhanced in the entire embryo injected with the lats1 and lats2 double MOs. Similar results were obtained in 2 independent experiments. (H) Projection view of confocal stack fluorescence images of the hindbrain in Tg(eef1a1l1:Gal4db-TEAD2ΔN-2A-mC);(UAS:GFP);(fli1:Myr-mC) embryos (52-54 hpf) injected with control MO (left) or lats1 and lats2 double MOs (right). Dorsal view, anterior to the top. Upper, GFP images (green); lower, the merged images (GFP, green; Myr-mC, red). Note that GFP expression is enhanced both in ECs and non-ECs by the injection of the lats1 and lats2 double MOs. Representative images of 2 independent experiments are shown. Scale bars, 50 µm in (A), 500 µm in (E) and (G), and 10 µm in (H). |

yap1 mRNA expression and Yap1-dependent transcriptional activity in zebrafish endothelial cells (ECs). Related to Figure 2. (A) We isolated EGFP-positive ECs from Tg(fli1:EGFP) embryos and GFP-positive neurons from Tg(huc:GFP) embryos at 2 dpf by fluorescence-activated cell sorting (FACS). Relative mRNA expression of yap1, tie2, fli1, and huc in FACS-sorted cells or whole embryos was analyzed by quantitative PCR (qPCR) analyses. Relative expression is calculated by the expression in the ECs or neurons divided by that in whole embryo. Data from three independent experiments are expressed as mean ± s.d. (n = 3). (B) Projection view of confocal stack fluorescence images of Tg(fli1:Gal4db-TEAD2ΔN-2A-mC);(UAS:GFP);(fli1:Myr-mC) embryos (52-56 hpf). Images of hindbrain and head. Dorsal view, anterior to the top. Images of eye and pharyngeal arch. Lateral view, anterior to the left. GFP images (green), mC images (red), and the merged images are shown. (C) Projection view of confocal images of the hindbrain (lower) in Tg(fli1:Gal4db-TEAD2ΔN-2A-mC);(UAS:GFP);(fli1:Myr-mC) embryos (at 42 and 52 hpf as indicated at the left) injected with Qdot 655 (white) into the heart to visualize perfused vessels. Dorsal view, anterior to the top. Left, GFP images (green); right, the merged images (Qdot 655, white; GFP, green; Myr-mC, red). While a significant population of ECs of perfused CCtA expresses GFP (white arrows), ECs of non-perfused CCtA do not (magenta arrows). (D) Time-sequential two photon stack images during or after lumen formation in ISV of Tg(fli1:EGFP-YAP) embryos (from 42 hpf). Elapsed time is indicated at the top (h:min). Note that EGFP-YAP dynamically shuttles between the nucleus (orange arrowheads) and the cytoplasm (white arrowheads) in lumenized ISV. Similar dynamic behaviors of EGFP-YAP were observed in 3 ISVs of 3 embryos. Scale bars, 10 µm. CCtA, cerebellar central artery; MMCtA, middle mesencephalic central artery; PCS, posterior communicating segment; LDA, lateral dorsal aorta; OV, optic vessel; AA1, mandibular arch; AA2, hyoid arch; AA3, first branchial arch; AA4, second branchial arch; ORA, opercular artery; PHBC, primordial hindbrain channel; BA, basilar artery; ISV, intersomitic vessel. |
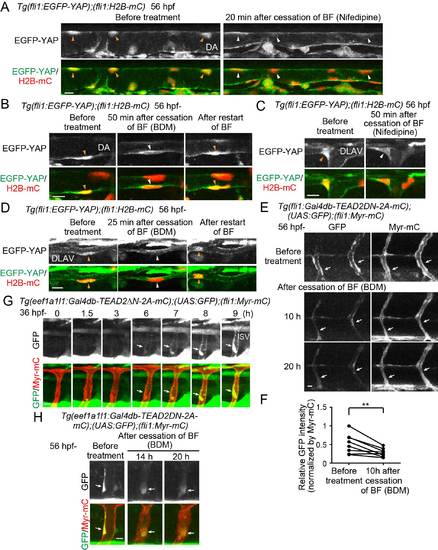
Blood flow-mediated regulation of Yap1, Related to Figure 4. (A) Time-sequential confocal stack fluorescence images of the DA in Tg(fli1:EGFP-YAP);(fli1:H2B-mC) embryos (at 56 hpf) before treatment and 20 min after cessation of blood flow (BF) by Nifedipine treatment. Note that EGFP-YAP is translocated from the nucleus marked by mCherry-tagged histone H2B (orange arrowheads) to the cytoplasm (white arrowheads) after cessation of BF. (B) Time-sequential confocal stack fluorescence images of the DA in Tg(fli1:EGFP-YAP);(fli1:H2B-mC) embryos before treatment, 50 min after cessation of BF by 3-Butanedione monoxime (BDM) treatment, and 2 h after restart of BF by washing out BDM. Note that EGFP-YAP relocated to the nucleus (orange arrowheads) after restart of BF. (C) Similarly to (A), the images of the DLAV in Tg(fli1:EGFP-YAP);(fli1:H2B-mC) embryos before treatment and 50 min after cessation of BF by Nifedipine treatment are shown. (D) Similarly to (B), the images of the DLAV in Tg(fli1:EGFP-YAP);(fli1:H2B-mC) embryos before treatment, 25 min after cessation of BF by BDM treatment, and 2 h after restart of BF by washing out BDM are shown. (E) Projection view of confocal stack fluorescence images of the ISVs in Tg(fli1:Gal4db-TEAD2ΔN-2A-mC);(UAS:GFP);(fli1:Myr-mC) embryos at 56 hpf (upper panels, before treatment) and those after cessation of BF by BDM treatment at the time point indicated at the left (lower panels) GFP images (left) and mC images (right) are shown. To avoid the bleaching of the fluorescent protein, confocal imaging was performed at limited time points (before treatment, 10 h, and 20 h after cessation of BF) as in Figure 4E. Arrows indicate GFP signal-positive ECs. (F) Fluorescent intensities of GFP in individual ISVs were quantified before treatment and 10 h after cessation of BF by BDM, as observed in (E). Relative intensity of GFP to that of Myr-mC was plotted (see STAR Methods). Total 8 ISVs of 3 embryos were analyzed. (G) Time sequential confocal stack images of ISV in Tg(eef1a1l1:Gal4db-TEAD2ΔN-2A-mC);(UAS:GFP);(fli1:Myr-mC) embryos (from 36 hpf). Elapsed time (h) is indicated at the top. An asterisk indicates newly formed lumen. Note that GFP expression in ISVs (arrows) is detected after lumen formation. Similar results were obtained in 4 independent experiments. (H) Projection view of confocal stack fluorescence images of the ISVs in Tg(eef1a1l1:Gal4db-TEAD2ΔN-2A-mC);(UAS:GFP);(fli1:Myr-mC) embryos at 56 hpf (left panels, before treatment) and those at the indicated time (center and right) after cessation of BF by BDM treatment. GFP images (upper) and the merged images (lower; GFP, green; Myr-mC, red) are shown. Note that GFP expression is reduced after cessation of blood flow (arrows). Similar results were obtained in 10 GFP signal-positive ISVs from 3 independent experiments. Scale bars, 10 µm. **P < 0.01. DA, dorsal aorta; DLAV, dorsal longitudinal anastomotic vessel; ISV, intersomitic vessel. |

Loss-of-function and gain-of-function phenotypes of Yap1 and Wwtr1 in cardiovascular development, Related to Figure 7. (A) Projection of confocal stack fluorescence images of the hindbrain in Tg(fli1:EGFP) larvae with WT (left) and yapncv101 allele (right) at 4 dpf. Dorsal view, anterior to the top. Arrows indicate deformed blood vessels. (B) Projection of confocal stack fluorescence images of the hindbrain in Tg(fli1:EGFP) larvae with WT (left) and yapncv101 allele (right) fixed at 7 dpf. Dorsal view. Circles indicate the branching in the CCtA. (C) Quantification of the number of branching in the CCtA of Tg(fli1:EGFP) WT (left) and homozygous yap1ncv101 mutant larvae fixed at 7 dpf as in (B). Each dot represents the number for an embryo. Horizontal lines represent mean ± s.d. (n = 4). Note that the number of CCtA branching is significantly decreased in the mutant larvae. (D) Projection of confocal stack fluorescence images of the trunk (upper) and hindbrain (lower) regions in Tg(fli1:Gal4db-TEAD2ΔN-2A-mC);(UAS:GFP);(fli1:Myr-mC) larvae at 4, 6, and 7 dpf. Upper, GFP images (green); lower, the merged images (GFP, green; Myr-mC, red). Note that while GFP expression is kept high in 4-6 dpf in the DLAVs, ISVs, CCtA, and MMCtA (white arrows), it is attenuated in the DA (magenta arrows). Representative images of 11 (trunk) and 7 (hindbrain) larvae are shown. (E) Projection of confocal stack fluorescence images of the trunk region in Tg(fli1:EGFP) embryos (26.5 hpf) injected with control MO (left) or lats1 and lats2 double MOs (right). Note that ISV sprouting from the DA is not affected by the injection of the lats1 and lats2 double MOs. Representative images of 7 (control MO) and 8 (lats1 and lats2 double MOs) embryos from 2 independent experiments are shown. (F) Time-lapse confocal imaging of the lumen formation in the ISVs of Tg(fli1:EGFP) embryos (from 34 hpf) injected with control MO (left) or lats1 and lats2 double MOs (right). Yellow asterisks indicate lumens connecting to the circulation. Note that timing of lumen formation is not affected by the injection of the lats1 and lats2 double MOs. Representative images of 9 embryos from 3 independent experiments are shown. (G) Time-lapse confocal imaging of the lumen formation in the ISVs of Tg(fli1:Gal4FF);(UAS:RFP) embryos (from 29 hpf) injected with UAS:EGFP-Yap1-5SA plasmid which drives the expression of EGFP-Yap1-5SA in ECs in a mosaic manner. Upper, the merged images (EGFP-Yap1-5SA, green; RFP, red); lower, RFP images (red). Arrows indicate an ISV expressing EGFP-Yap1-5SA. Note that lumen formation occurs normally even in the ISV expressing EGFP-Yap1-5SA. Representative images of 3 independent experiments are shown. (H) Time-sequential confocal images of Tg(fli1:Gal4FF);(UAS:RFP) embryos (from 29 hpf) injected with UAS:EGFP-Yap1-5SA plasmid, together with control MO or cardiac troponin T type 2a (tnnt2a) MO. Arrows indicate an ISV expressing EGFP-Yap1-5SA. Note that the lumen formation is blocked in the ISVs of tnnt2a morphants even in the presence of EGFP-Yap1-5SA. Representative images of 2 independent experiments are shown. (I) Bright-field images of WT (left), yap1ncv101;wwtr1ncv114/+ (middle); and yap1ncv101;wwtr1ncv114 (right) embryos at 30 hpf. Note that the yap1ncv101;wwtr1ncv114 embryos exhibit severe developmental defects. (J) Projection of confocal stack fluorescence images of the trunk in Tg(fli1:Myr-mC) WT (upper left), yap1ncv101/+;wwtr1ncv114 (upper right), yap1ncv101;wwtr1ncv114/+ (lower left), and yap1ncv101;wwtr1ncv114 (lower right) embryos at 30 or 32 hpf . Axial vessels were not formed in yap1ncv101;wwtr1ncv114 embryos (arrowheads). Representative images of 2 independent experiments are shown. (K) Stereomicroscopic images of Tg(myosin light polypeptide 7(myl7):NLS-tdEosFP) WT (left), yap1ncv101;wwtr1ncv114/+ (middle), and yap1ncv101;wwtr1ncv114 (right) embryos at 30 hpf. Ventral view. Upper, bright-field images; lower, tdEosFP images (green flourescnece). Note that yap1ncv101;wwtr1ncv114/+ and yap1ncv101;wwtr1ncv114 embryos exhibit cardia bifida. (L) Graph shows the percentage of the number of embryos showing cardia bifida (black) and no circulation (gray) among the yap1 and wwtr1 mutant (or WT) embryos. Total number of each group embryos are indicated at the top. The results were obtained from 2 independent experiments . Embryos from incrosses of heterozygous yap1ncv101/+;wwtr1ncv114/+ zebrafish were observed at 30 hpf to quantify cardia bifida as in (K) and at 2 dpf to check the circulation, and subsequently genotyped by genomic PCR. All yap1ncv101;wwtr1ncv114 embryos died until 32 hpf before the circulation (#). Scale bars, 10 µm in (A, B, D, E, F, G, H, and J), 100 µm in (I and K). *P < 0.05. |
Reprinted from Developmental Cell, 40, Nakajima, H., Yamamoto, K., Agarwala, S., Terai, K., Fukui, H., Fukuhara, S., Ando, K., Miyazaki, T., Yokota, Y., Schmelzer, E., Belting, H.G., Affolter, M., Lecaudey, V., Mochizuki, N., Flow-Dependent Endothelial YAP Regulation Contributes to Vessel Maintenance, 523-536.e6, Copyright (2017) with permission from Elsevier. Full text @ Dev. Cell