
- Title
-
Shh promotes direct interactions between epidermal cells and osteoblast progenitors to shape regenerated zebrafish bone
- Authors
- Armstrong, B.E., Henner, A., Stewart, S., Stankunas, K.
- Source
- Full text @ Development

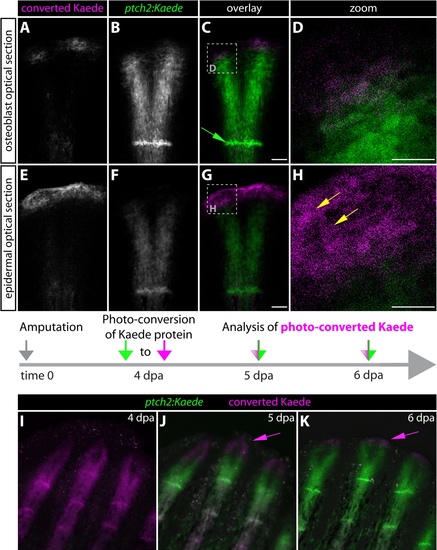
ptch2:Kaede expression and photoconversion reveals transient Hedgehog/Smoothened signaling restricted to distal osteoblast progenitors and basal epidermis during fin regeneration. (A,B) Whole-mount images showing Kaede expression (green) in a 96 hpa fin from a ptch2:Kaede fish. (B) A high-magnification image of the boxed region in A. White brackets mark the split domains of Kaede at the distal end of the regenerate. Green arrows indicate Kaede+ cells at newly re-forming joints. (C-F) Antibody-stained longitudinal fin sections from a 72 hpa ptch2:Kaede fish. Individual Runx2 (C) and Kaede (D) channels are shown in gray scale. Overlay images with Runx2 in magenta and Kaede in green are shown in E and F (a magnification of the boxed region in E). Nuclei are in blue. Yellow arrows indicate Kaede+ basal epidermis; white arrows mark Kaede+/Runx2+ Obs; magenta arrows indicate proximal Runx2+ Obs lacking Kaede. The dotted magenta line indicates the boundary between Kaede+ basal epidermis and pObs. (G) ptch2:Kaede photo-conversion experiment overview. (H-L) Whole-mount bright-field (H,I) and fluorescent (J-L) images of the regenerating caudal fin from a ptch2:Kaede photo-conversion experiment fish. (J) The fin is shown at 5 dpa, immediately after photoconverting Kaede protein in a distal field (tissue marked by the magenta dashed line). (K,L) The same fin 24 h post-conversion (6 dpa) imaged for Kaede expression. The dashed box in K marks the enlarged region in L. Unconverted and new Kaede is green; photo-converted Kaede is magenta. The green arrow marks cells in a forming joint that expressed Kaede within the previous 24 h. The white bracket indicates the narrow distal domain of new Kaede production since photoconversion. The magenta arrow indicates epidermis near the tip of the fin that had displaced distally while retaining photo-converted Kaede. Dashed yellow lines in A,E,J,K show amputation planes. Scale bars: 50 µm in E; 10 µm in F; 500 µm in J,K; 250 µm in L. |

shha is briefly transcribed by distal migrating epidermal cells, whereas ihha is restricted to re-differentiating progenitor osteoblasts. (A) qRT-PCR analysis of the relative expression levels of shha, shhb, ihha, ihhb, runx2a and sp7 in 96 hpa fin tissue. The relative levels of the indicated transcripts are means of four fins normalized to rpl8 expression. Error bars represent 1 s.d. (B-E) An immunostained fin section from a 72 hpa shha:GFP fish showing GFP (white), Runx2 (red) and sp7 (green) expression. Nuclei are in blue. E is a high-magnification view of the dashed box in D. (F-O) Fin sections from a 72 hpa fish stained by RNA in situ hybridization for shha (F-J) or ihha (K-O) transcripts (blue) and with Runx2 (red) and sp7 (green) antibodies. Single channels are shown in gray scale (F-I,K-N). Nuclei are gray in the overlay images (I,J,N,O). (J,O) Enlarged regions marked in I,N, respectively. The white bracket indicates the extent of epidermal cells expressing shha relative to pObs. Yellow arrows show Runx2+/sp7+ Obs that express ihha; magenta arrows mark distal Runx2+ pObs that lack ihha mRNA. The dashed yellow lines indicate amputation sites. Scale bars: 25 μm in J,O; 50 µm in E; 50 μm in B-D,F-N. |
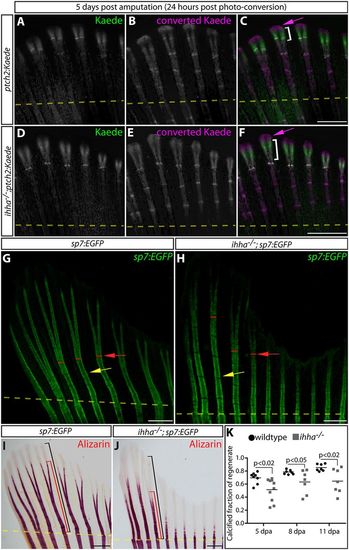
Ihha promotes the efficient calcification of regenerated bone by non-canonical Hedgehog signaling. (A-F) Whole-mount Kaede fluorescence images of 5 dpa caudal fins from ptch2:Kaede (A-C) and ihha−/−;ptch2:Kaede (D-F) fish 24 h after photoconversion. Photoconverted pre-existing Kaede is magenta; Kaede produced after photoconversion is green. Magenta arrows indicate extreme distal epidermal tissue exclusively expressing converted Kaede. The white brackets indicate the domain of newly expressed Kaede protein. (G,H) Whole-mount images showing GFP-expressing osteoblasts in fins from sp7:EGFP and ihha−/−;sp7:EGFP fish at 11 dpa. Yellow arrows mark newly formed joints. Red lines and arrows denote points of ray bifurcation. (I,J) Bright-field images of Alizarin Red-stained sp7:EGFP(I) and ihha−/−;sp7:EGFP (J) fins at 11 dpa. Black and red brackets show the total length of the regenerate and the extent of mineralization from the site of amputation, respectively. Yellow dashed lines in all panels show amputation positions. (K) Quantification of the relative extent of calcified regenerated bone in sp7:EGFP versus ihha−/−;sp7:EGFP fish at 5, 8 and 11 dpa. Means and data points representing individual fish are shown. Significant differences between control and ihha-null fish (P<0.05) were determined by two-tailed Student's t-tests. Scale bars: 500 μm. |
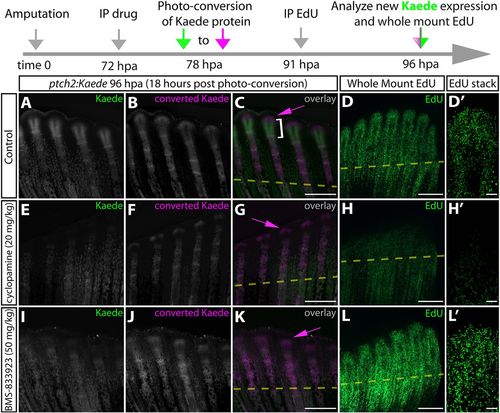
BMS-833923, a newly identified potent zebrafish Smoothened inhibitor, shows that Hedgehog/Smo signaling does not impact fin regenerative outgrowth. (A-L′) Whole-mount fluorescence images of 96 hpa fins from ptch2:Kaede fish 18 h after Kaede photoconversion and 5 h after EdU injection. Regenerating fish were treated for 24 h with DMSO (A-D′), cyclopamine (E-H′) or BMS-833923 (I-L′). Newly produced Kaede and converted Kaede are green and magenta, respectively, in overlay images (C,G,K). Magenta arrows indicate cells with converted Kaede. White brackets mark the domain of new Kaede expression in the 18 h since photoconversion. (D,H,L) Fins from the same fish shown for Kaede fluorescence processed to reveal EdU-incorporating nuclei in green. (D′,H′,L′) Confocal stack images showing EdU incorporation at the distal aspect of single re-forming rays. The timeline at the top of the figure details the experimental design. Scale bars: 500 μm. |

BMS-833923 demonstrates that Hedgehog/Smoothened signaling is dedicated to bony ray branching during the outgrowth phase of fin regeneration. (A-J) Whole-mount images of fins from the same two sp7:EGFP fish acquired prior to amputation and at 12 and 30 days post-amputation (dpa). The fish are treated with either control DMSO or BMS-833923 at 48 and 72 hpa. (A-C,F-H) Fluorescence images showing osteoblast GFP expression in green. (D,I) Rotterman contrast images. Periodic high-contrast patches along the rays are joints. Red lines and arrows mark ray bifurcation points. (E,J) Bright-field images of Alizarin Red-stained fins collected from the same fish to visualize mineralized bone. Amputation planes are indicated with dashed yellow lines. (K,L) Wide-field whole-mount GFP fluorescence and bright-field overlay images of 5 dpa fins from shha:GFP fish following injections with DMSO or BMS-833923 at 48 and 72 hpa. Green brackets indicate the extent of epidermal shha:GFP expression along the proximal-distal axis. Student's t-test shows the 142% mean increase in the length of the shha:GFP domain is significant [n=5 control and 10 BMS-833923-treated fish (60 scored rays), P<0.0001]. Scale bars: 2 mm in A,F; 1 mm in B-E,G-J; 500 µm in K,L. |
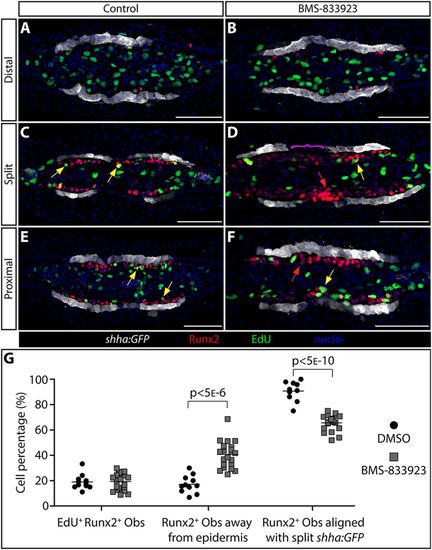
Shha-driven Smoothened signaling directs progenitor osteoblasts to migrate in step with transiently split basal epidermal clusters at the onset of ray branching. (A-F) Runx2 and EGFP immunostaining (red and white, respectively) and EdU incorporation (2 h treatment, green) on transverse 96 hpa fin sections from individual shha:GFP fish treated at 48 and 72 hpa with DMSO (A,C,E) or BMS-833923 (B,D,F). Nuclei are blue. (A,B) Far distal sections beyond the distal-most pObs. (C,D) Sections from positions where shha-expressing epidermal cells have split into two clusters on each side of the fin. (E,F) Further proximal sections where shha is first induced by distal migrating epidermal cells. Yellow arrows indicate Runx2+/EdU+ cells located more than one cell layer from shha:GFP-expressing basal epidermis. Red arrows indicate Runx2+ pObs two or more cell layers distant from shha:GFP-positive epidermal cells. The magenta bracket in D highlights Runx2+ pObs that span the junction between split shha:GFP domains in BMS-833923-treated fish. (G) Quantification of pOb proliferation and the relative position of pObs to epidermal cells in regenerating fins from the above and similar DMSO versus BMS-833923 treated shha:GFP fish. Only images at ‘split’ positions are scored. Left plots: the fraction of EdU incorporating Runx2+ pObs. Middle plots: the fraction of pObs not directly adjacent to GFP+ epidermal cells. Right plots: the fraction of pObs aligned with split clusters of shha:GFP-expressing epidermis. Each data point represents a scored independent section (11 individual rays from five DMSO-treated fish and 23 rays from seven BMS-833923-treated fish). Two-tailed Student's t-tests were used to determine statistically significant differences (P<0.05) between the means of control versus small-molecule-treated samples. Scale bars: 50 μm. |

shha:GFP-expressing basal epidermal cells extend cellular protrusions through incompletely assembled basement membrane to contact Runx2+ progenitor osteoblasts. (A-P) GFP (white), laminin (magenta) and Runx2 (green) antibody stained fin sections from 96 hpa shha:GFP fish. All images are 1 airy unit (∼1 µm) single optical confocal sections, except D, which is a structured illumination microscopy (SIM) image representing an ∼100 nm section. (A-D) Longitudinal section showing the distal regenerate where the shha-expressing basal epidermis is split into two clusters and Hh/Smo signaling is activate in both pObs and basal epidermis. (C) An overlay showing Runx2 staining together with A and B. (D) A high-magnification SIM image of the boxed area in C. (E-G) A proximal field from the same longitudinal section shown in A-D. (H-P) Transverse sections representing three positions along the proximal-distal axis from a single regenerating ray. (H-J) An extreme distal section beyond the distal extent of Runx2+ pOb pools. (K-M) Section from a position where shha:GFP-expressing basal epidermis is split into two clusters on each side of the regenerating fin. (N-P) A further proximal section where shha expression has initiated in epidermal cells but prior to their division into split clusters. The dashed boxes in I, L and O mark regions shown at higher magnification in J, M and P, respectively. White arrows indicate cellular protrusions from shha:GFP+ cells that contact or enshroud Runx2+ osteoblasts. White asterisks mark gaps in the basal lamina. Magenta arrows show a continuous laminin-containing basement membrane that physically separates the basal epidermis from Runx2+ pObs. Scale bars: 5 µm in D,J,M,P; 50 µm in C,G,I,L,O. |
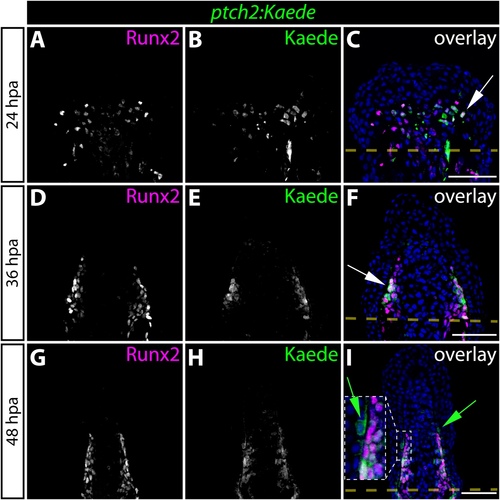
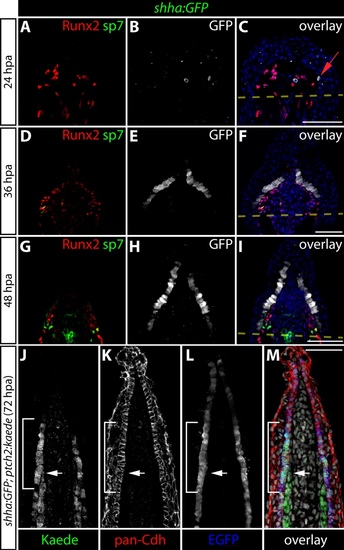
Hedgehog/Smoothened signaling initiates in osteoblast progenitors before expanding to neighboring basal epidermal cells during the course of fin regeneration. (A-I) Immunostaining showing Runx2 (magenta) and Kaede (green) protein in fin sections prepared from ptch2:Kaede fish at 24 (A-C), 36 (D-F), and 48 (G-I) hours post-amputation (hpa). Ptch2:Kaede is first expressed in Runx2+ pObs at 24 hpa and is excluded from all other cell types. By 36 hpa, nearly all Runx2+ cells co-express Kaede. White arrows indicate Runx2+/Kaede+ pObs. By 48 hpa, ptch2:Kaede is also expressed in the basal epidermis adjacent to Kaede+/Runx2+ pObs. Green arrows point to Kaede+ basal epidermal cells. For panel I, the region bound by a dashed white box is shown in higher magnification in the inset panel. Amputation planes are indicated with a dashed yellow line. Hoechst-stained nuclei are blue in all overlay images. Scale bars: 50 μm. |
The tip of regenerating fins contains previously Hedgehog/Smoothenedresponsive basal epidermal cells that subsequently moved further distally. (A-H) Kaede expression in the caudal fin of a 5 dpa ptch2:Kaede fish 24 hours after photoconversion. Images are selected single optical sections from a confocal z-stack of the same ray. (A-D) Optical section focused on the osteoblast layer. Dashed box in C indicates the region shown at higher magnification in panel D. Converted Kaede protein is exclusively found proximal to osteoblasts of the latest formed joint (green arrow). (E-H) Epidermal-focused optical section from the confocal z-stack. Dashed box in G indicates the zoomed region shown in H. (H) Yellow arrows point to converted Kaede protein at the distal tip of the regenerate. (I-K) Kaede expression at 5 and 6 dpa in ptch2:Kaede fish after photoconverting at 4 dpa. Previously Hh/Smo-responsive cells display converted Kaede in magenta, cells with both converted and nascent Kaede are white, and cells that transmitted Hh/Smo signals only after conversion show nascent Kaede alone in green. Magenta arrows indicate the extreme distal and previously Hh/Smo-responsive basal epidermal cells. Scale bars for D and H: 25 μm. All other scale bars: 50 μm. |

The domain of Shha-expressing basal epidermis begins to split at 3 days post fin amputation. (A-D) Fluorescent whole-mount images of the caudal fin of shha:GFP fish at 2 dpa (panel A), 3 dpa (panel B), 4 dpa (panel C), and 5 dpa (panel D). Green brackets indicate the splitting of the shha:GFP domain beginning at 3 dpa. Scale bars: 100 μm. |
Spatial and temporal analysis of shha:GFP expression during fin regeneration. (A-I) Caudal fin sections from shha:GFP fish at 24 (A-C), 36 (D-F), and 48 (G-I) hpa immunostained with antibodies against Runx2 (red), sp7 (green) and GFP (white) and imaged by confocal microscopy. A red arrow indicates a GFP+ basal epidermal cell at 24 hpa. By 36 hpa, nearly every basal epidermal cell is GFP+. Amputation planes are marked with a dashed yellow line. Hoechst-stained nuclei (blue) are shown in the overlay panels. (J-M) An immunostained fin section from a 72 hpa shha:GFP;ptch2:Kaede fish showing pan-cadherin (red), Kaede (green), and GFP (blue). The white arrow indicates the distal extent of Kaede-expressing osteoblasts. The white bracket shows basal epidermis with ptch2-driven Kaede protein. Hoechst-stained nuclei are grey in the overlay panel. Scale bars: 50 μm. |

Ihha is not required for bone growth, initial differentiation, or patterning but does support bone re-calcification during fin regeneration. (A) Quantitative RT-PCR analysis showing relative expression levels of shha, shhb, ihha, and ihhb in 96 hpa wild-type and ihha-/- regenerates. Normalized and relative levels of the indicated transcripts represent the means of three fins. Error bars are one standard deviation. (B-E) Von Kossa stained 96 hpa fin sections from ihha-/- and wild-type clutchmate fish. Calcified bone is stained black and black arrows denote the extent of calcified bone in the regenerate. Dashed boxes in B and C indicate zoom panels shown in D and E, respectively. (F) Quantified re-calcification of ihha-/- and wild-type clutchmate fish at 96 hpa using von Kossa-stained sections. The calcified fraction represents the length of the calcified region (gray bars) divided by the total regenerate length. At least four sections were measured to generate a mean value for each individual fish (plotted on the graph). Statistically significant differences are indicated (p < 0.05, two-tailed Student’s t-tests). (G-J) Brightfield images showing Alizarin red-stained ihha-/- (n =8) and wild-type (n = 6) fins collected at 8 dpa (G, I) and six weeks later (H, J). (K-N) Whole mount Alizarin red staining of unamputated adult ihha-/- (n = 3) and wild-type (n = 3) clutchmates. L and N show zooms of panels K and M, respectively. (O, P) Fin sections collected 72 hpa from wild-type and ihha-/- fish stained with Runx2 (red), sp7 (green) antibodies and, by click chemistry, EdU (white, 6 hour pulse). Hoechst-stained nuclei are blue. (Q) Quantification of osteoblast subtypes and EdU incorporation at 72 hpa. Bars show the mean percentile representation of each osteoblast subtype on comparable sections (n = 10 rays (wild-type) and n = 11 rays (ihha-/-) compiled from > 5 fish). Error bars are one standard deviation. The proportion of each cell population that incorporated EdU is indicated by the extent of gray shading relative to the bar’s height. For all panels, amputation planes are indicated with a dashed yellow line. Scale bars: 50 μm. |

BMP signaling in regenerating fin osteoblasts is independent of Ihha. (A-L) Images of fin sections from 72 hpa sp7:EGFP and ihha-/-;sp7:EGFP fish immunostained with Runx2 (white), EGFP (green) and pSmad1/5/8 (red) antibodies. White arrows (E and K) indicate distal Runx2+/pSMAD1/5/8- pObs. Yellow arrows (F and L) denote more proximal Runx2+/sp7+/pSmad1/5/8+ differentiating osteoblasts. Dashed boxes in D and J represent zoom panels shown in E and F (D) and K and L (J). Hoechst-stained nuclei are shown in blue. Dashed yellow lines indicate the site of fin resection. Scale bars: 50 μm. |

BMS-833923 potently inhibits Hedgehog/Smoothened signaling in zebrafish. (AR) Whole mount images of Kaede fluorescence dynamics 18 hours post-conversion in ptch2:Kaede animals treated with either DMSO, cyclopamine (20 mg/kg), BMS-833923 (50 mg/kg), Vismodegib (75 mg/kg), Erismodegib (50 mg/kg), SANT-1 (50 mg/kg), Taladegib (8.25 mg/kg), Glasdegib (50 mg/kg), or PF-05274857 (100 mg/kg). Small molecules were administered at 72 hpa, Kaede protein was photoconverted on half of the fin using 405 nm light at 78 hpa, and imaging was performed at 96 hpa. Newly expressed Kaede protein is green, photoconverted Kaede is magenta. At least four fish were analyzed from each group. The white brackets indicate the domain of new Kaede expression in the 18 hours post-photoconversion and the magenta arrows denote previously Kaede-positive epidermis. Dashed yellow lines show the position where fins were amputated. Scale bars: 500 μm. |
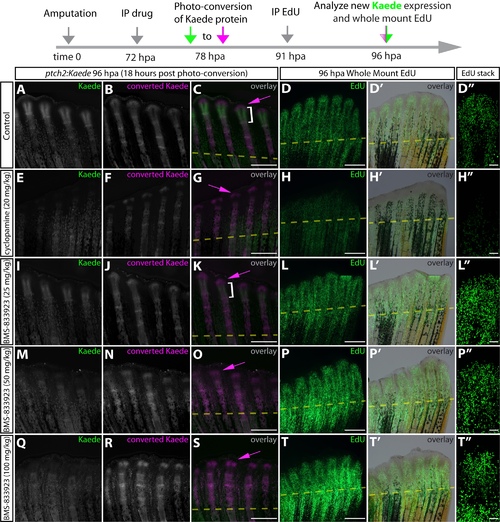
The smoothened inhibitor BMS-833923 does not exhibit the global antiproliferative effect of cyclopamine on regenerating zebrafish fins. (A-T) Whole-mount fin images showing ptch2:Kaede expression and EdU incorporation in DMSO (A-D''), cyclopamine (20 mg/kg) (E-H''), BMS-833923 (25 mg/kg) (I-L''), BMS-833923 (50 mg/kg) (M-P''), or BMS- 833923 (100 mg/kg) (Q-T'') treated fish at 96 hpa. At 72 hpa, each fish was injected intraperitoneally with the indicated small molecule or DMSO (control). Kaede protein was photoconverted at 78 hpa and tissue was collected at 96 hpa after a 5 hour pulse with EdU. New Kaede protein is shown in green and photoconverted Kaede in magenta. At least four fish were analyzed from each group. The white bracket indicates the domain of new Kaede expression since photoconversion and the magenta arrows denote previously Hedgehog/Smoothened responsive epidermis. EdU-incorporating nuclei are green in panels D, H, L, P, and T. Overlays with corresponding brightfield images are shown (D', H', L', P', T'). Panels D'', H'', L'', P'', T'' show confocal images of individual rays from each sample. Note: control (A-D), cyclopamine (20 mg/kg) (E-H), and BMS-833923 (50 mg/kg) (M-O) images are also shown in Figure 5. Scale bars for D'', H'', L'', P'', T'': 50 μm. All other scale bars: 500 μm. |
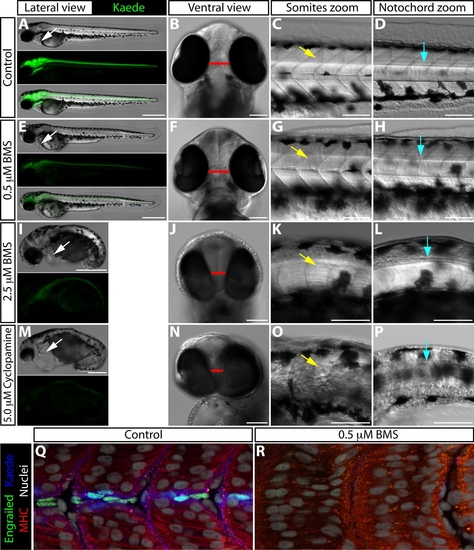
BMS-833923 treatment recapitulates specific developmental defects observed in smoothened-null embryos. (A-P) 54 hpf ptch2:Kaede embryos treated with DMSO (A-D), 0.5 μM BMS-833923 (E-H), 2.5 μM BMS-833923 (I-L), or 5 μM cyclopamine (M-P) beginning at 1.5 hpf. (A, E, I, M) Lateral view showing overall embryo morphology and Kaede expression. BMS-833923 treated embryos display a dose dependent decrease in Kaede expression, as seen in adult regeneration experiments. White arrows indicate the heart. Cardiac edema is observed in 2.5 μM BMS-833923 (I) and, to a greater extent, 5 μM cyclopamine (M) treated embryos. (B, F, J, N) Ventral view showing reduced head size and partial cyclopia in 2.5 μM BMS-833923 (J) and 5 μM cyclopamine (N) treated embryos. Red bar indicates the distance between the eyes. (C, G, K, O) Higher magnification lateral view focused on the somites. Yellow arrows point to developing somites. U-shaped somites and incomplete muscle differentiation are seen in the 2.5 μM BMS-833923 treated embryo (K). Somites are more substantially disorganized in the cyclopamine-treated embryo (O). (D, H, L, P) Higher magnification lateral view focused on the notochord. BMS-833923 treated embryos have a reduced and disorganized notochord and floor plate. The floor plate and notochord of cyclopamine-exposed embryos is more severely affected, becoming nearly indistinguishable from surrounding tissue. Blue arrows point to the lateral floor plate. (Q, R) Confocal images of 31 hpf control and 0.5 μM BMS-833923-exposed (2 – 31 hpf) ptch2:Kaede embryos antibody stained for Engrailed (green, muscle pioneer cells), myosin heavy chain (MHC, red, muscle), and Kaede (blue). Hoechst-stained nuclei are grey. Scale bars for (A, E, I, M): 500 μm. All other scale bars: 100 μm. |

BMS-833923 treatment produces sustained inhibition of Hh/Smo signaling. Fins from ptch2:Kaede fish were amputated and subsequently injected with DMSO or 40 mg/kg BMS-833923 at 48 and 72 hpa. (A, E) At 96 hpa, Kaede protein was photoconverted on half of the fin and immediately imaged. Fish were monitored for expression of new Kaede protein at 6 dpa (B, F), 9 dpa (C-C', G-G'), and 18 dpa (D-D', H-H'). Scale bars: 500 μm. |
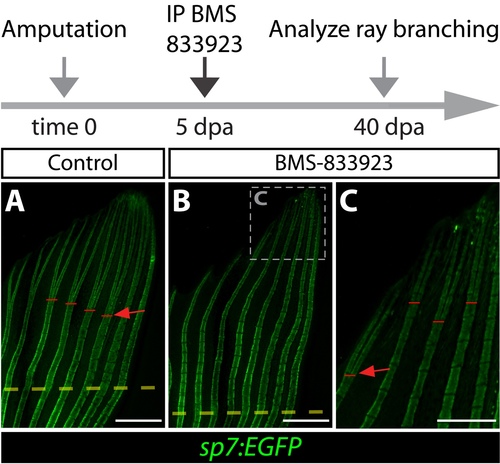
BMS-833923 exposure at 5 dpa, when branching is actively occurring, blocks and/or substantially delays ray bifurcation during fin regeneration. (A-C) Whole mount fluorescence images of caudal fins from sp7:EGFP zebrafish at 40 dpa after DMSO or BMS- 833923 treatment at 5 dpa. Red bars and arrows indicate the point of ray bifurcation. The dashed box in panel B marks the region shown at high magnification in panel C. Scale bars in A and B: 1 mm; C: 500 μm. |

Hedgehog/Smoothened signaling directs osteoblasts to laterally migrate in concert with transiently split domains of shha:GFP-expressing basal epidermis. Representative transverse sections from control and BMS-833923-treated shha:GFP fins at 96 hpa immunostained for Runx2 (red) and GFP (white) and developed using click chemistry to visualize EdU (green) incorporating cells. The sections shown represent distinct rays from two DMSO and three BMS-833923-treated fish. (A-E) Sections from the extreme distal region of the regenerating fin, beyond the location of self-renewing pObs. Stable GFP protein persists in previously shha-expressing basal epidermal cells, which now populate a single contiguous domain on each side of the fin. (F-J) Sections from the region where shha:GFP-expressing epidermis transiently split into two domains on both sides of the fin. (K-O) Proximal sections from the distal regenerate where basal epidermal cells initiate shha:GFP-expression but have not yet split into two pools. Yellow arrows point to Runx2+/EdU+ cells located more than 1 cell layer from shha:GFP-expressing epidermis. Red arrows indicate Runx2+ pObs located more than 2 cell layers distant from shha:GFP-positive epidermal cells. The magenta brackets denote Runx2+ pObs spanning the junction between split shha:GFP domains in sections from BMS-833923- treated fish. Scale bars: 50 μm. |

Shha-driven Smoothened signaling directs progenitor osteoblasts to align against the basal epidermis but does not influence their proliferation. (A, B) Runx2, sp7 and EGFP immunostaining (red, green, and white, respectively) on longitudinal 96 hpa fin sections from individual shha:GFP fish treated at 48 and 72 hpa with DMSO (panel A) or 40 mg/kg BMS-833923 (panel B). Nuclei are blue. White brackets demonstrate the extension of Runx2+ pObs. BMS-833923 treatment causes misalignment with the distally moving basal epidermis, resulting in both increased layered and incompletely extended Runx2+ pObs. White arrowheads indicate the approximate position of transverse “split” sections shown in Fig. 7C and D. (C) Quantification of the number of Runx2+ pOb cells distal to the first Runx2/sp7+ cells. Each data point represents a scored independent section (10 individual rays from three DMSO treated fish and 13 rays from four BMS-833923 treated fish). (D, E) Runx2 (red) and EdU incorporation (four hour treatment, white) on longitudinal 54 hpa fin sections from individual fish treated at 48 with DMSO (panel D) or 50 mg/kg BMS-833923 (panel E). Nuclei are blue. (F) Quantification of Runx2+ pOb proliferation after DMSO or BMS-833923 treatment. Data represents the scoring of EdU-incorporating pObs from 14 individual rays from three DMSO treated fish and 10 rays from five BMS-833923 treated fish. Error bars are one standard deviation. Scale bars in A and B: 20 μm; D and E: 50 μm. |
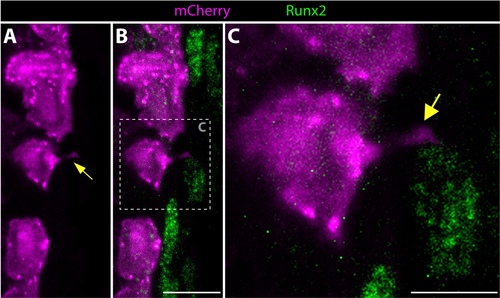
Distal basal epidermis, fluorescently-labeled using mosaic transgenic zebrafish, extend cellular projections that contact neighboring Runx2+ osteoblast progenitor cells. (A-C) An immunostained distal longitudinal fin section containing mosaic-labeled epidermal cells from a Tg(dusp6:Cre-ERT2, EAB:EGFP-FlEx-mCherry) 96 hpa regenerating fish showing mCherry (magenta) and Runx2 (green) protein. The image is an ~1 μm thick optical section from a confocal stack. Yellow arrows point to a basal epidermal cellular projection that contacts a neighboring pOb. The dashed box in B indicates the zoomed region shown in C. Scale bars are 10 μm (panel B) and 5 μm (panel C). |