
- Title
-
Glutathione peroxidase 4 inhibits Wnt/β-catenin signaling and regulates dorsal organizer formation in zebrafish embryos
- Authors
- Rong, X., Zhou, Y., Liu, Y., Zhao, B., Wang, B., Wang, C., Gong, X., Tang, P., Lu, L., Li, Y., Zhao, C., Zhou, J.
- Source
- Full text @ Development
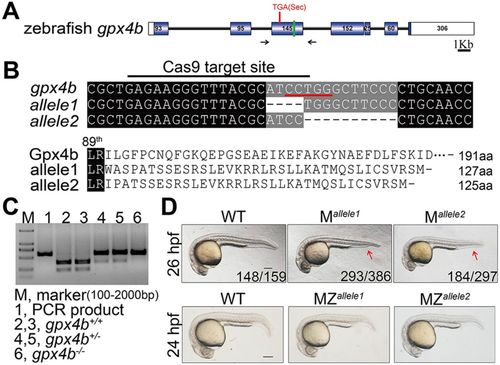
Generation of the gpx4b mutant using the CRISPR/Cas9 system, and the gross phenotypes of maternal and maternal-zygotic loss of gpx4b in zebrafish embryos. (A) Schematic representation of the gpx4b locus. Exons are shown as boxes (filled box, protein-coding region; open box, UTR). Introns are shown as lines. The location of the Sec codon, TGA, is indicated with a red line. The green line indicates the location of the Cas9 target site. Black arrows show the position of genotyping primers. (B) The sequence of Cas9 target site and predicted protein sequences of wild type (WT) and mutant gpx4b alleles (allele1 and allele2). Upper panel: the sequence of the Cas9 target site is indicated with a black line and the two gpx4b-null mutant alleles are shown. The black dashed line indicates a deletion. Red line, restriction enzyme BciT1301 recognition sequence. Lower panel: the protein sequences of wild type and mutants are shown. (C) Genotyping result using restriction enzyme BciT1301 digestion assay. (D) Representative views of wild type as well as maternal (M) and maternal-zygotic (MZ) mutants of gpx4b at the indicated stages. The arrow shows the reduced ventral tail fin. The frequency of embryos with the indicated patterns is shown in the bottom right corner of each panel. n=4 females for allele1, n=3 females for allele2. At least two clutches of embryos from each female were analyzed. Lateral views with anterior towards the left. Scale bar: 200 µm. PHENOTYPE:
|
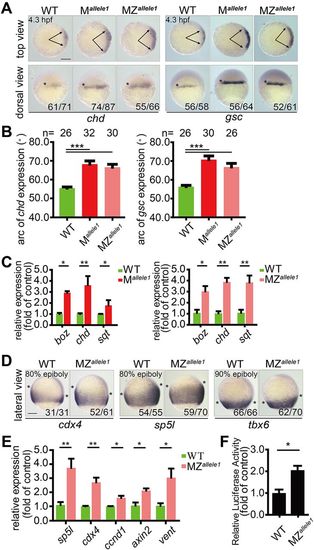
Maternal loss of gpx4b promotes dorsal organizer development and depletion of gpx4b increases Wnt/β-catenin activity. (A) Expression of dorsal organizer markers chd and gsc mRNA in each indicated group of embryos at 4.3 hpf, as assessed by whole-mount in situ hybridization. Upper panels are animal pole views with dorsal towards the right. Arrows indicate the edges of the chd and gsc mRNA expression domains. Lower panels are dorsal views with animal pole upwards. The frequency of embryos with the indicated patterns is shown in the bottom right corner of each group. (B) Quantification of the arc of marker expression shown in A. (C) The expression levels of boz, chd and sqt mRNA in each indicated group of embryos at 4.3 hpf, as analyzed by qRT-PCR. (D) Expression of direct zygotic Wnt markers cdx4, sp5l and tbx6 in MZallele1 mutants and wild-type embryos at 80% or 90% epiboly stage (9 hpf). Asterisks indicate the edges of the indicated mRNA expression domains. Lateral views with dorsal towards the right and animal pole upwards. (E) The mRNA expression levels of indicated zygotic Wnt direct target genes in wild-type and MZallele1 mutant embryos at 8 hpf analyzed by qRT-PCR. (F) MZallele1 mutants show increased endogenous Wnt signaling. Values are means±s.e.m. (n=3). *P<0.05; **P<0.01; ***P<0.001. Unpaired t-test, two-tailed. Scale bars: 200 µm. EXPRESSION / LABELING:
PHENOTYPE:
|
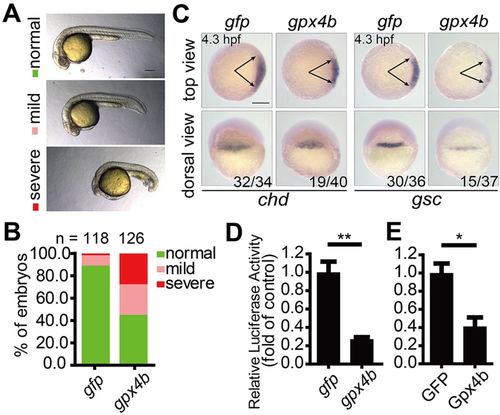
Overexpression of gpx4b ventralizes zebrafish embryos and inhibits Wnt activity. (A) Classification of phenotypes at 24 hpf caused by forced expression of 600 pg gpx4b mRNA. (B) Percentage of embryos in each category as shown in A. Results are from three independent experiments and the total embryo numbers are given at the top. (C) Expression patterns of chd and gsc marker genes in embryos injected with 600 pg gfp or gpx4b mRNA at 4.3 hpf. The frequency of embryos with the indicated phenotypes is shown in the bottom right corner of each group. (D) Overexpression of Gpx4b inhibits endogenous Wnt signaling in vivo. Embryos were injected with TOPFlash reporter DNA with 600 pg gfp or gpx4b mRNA. (E) Gpx4b inhibits endogenous Wnt signaling in vitro. HEK293T cells were transfected with 600 ng GFP plasmid DNA or Gpx4b plasmid DNA together with TOPFlash reporter DNA. Values are means±s.e.m. (n=3). *P<0.05; **P<0.01. Unpaired t-test, two-tailed. Scale bars: 200 µm. |
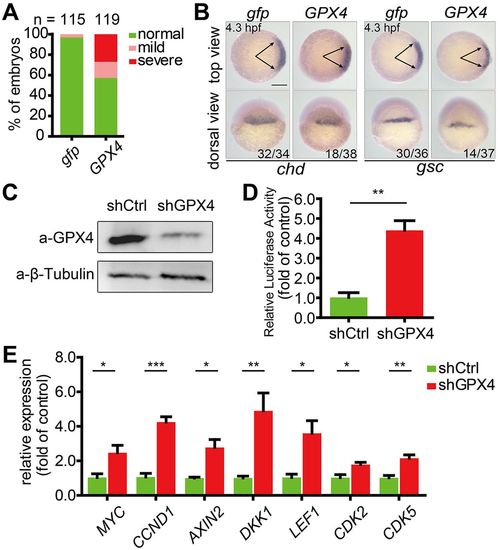
Wnt inhibitory activity is evolutionarily conserved between zebrafish Gpx4b and human GPX4. (A) The phenotypes of embryos injected with 600 pg gfp or GPX4 mRNA were scored and presented following the criteria described in Fig. 3A. Results are from three independent experiments and the total embryo numbers are given at the top. (B) Human GPX4 alters the expression of chd and gsc in zebrafish embryos at 4.3 hpf. Embryos injected with 600 pg gfp or GPX4 mRNA were analyzed by whole-mount in situ hybridization. The frequency of embryos with the indicated phenotypes is shown in the bottom right corner of each group. (C) Effectiveness of GPX4 shRNA at the protein level in HEK293T cells. shCtrl, control shRNA; β-tubulin, internal control. (D) Knockdown of GPX4 enhances endogenous Wnt signaling in vitro. The stable control or GPX4 knockdown lines were transfected with TOPFlash reporter DNA. (E) Stable knockdown of GPX4 in HEK293T cells increased the expression of the indicated Wnt direct target genes. Expression levels were analyzed by qRT-PCR. Values are means±s.e.m. (n=3). *P<0.05; **P<0.01; ***P<0.001. Unpaired t-test, two-tailed. Scale bar: 200 µm. |

GPX4/Gpx4b inhibits Wnt activity at the Tcf level. (A,B) Gpx4b inhibits the action of indicated Wnt activators in vivo. Representative images of embryos injected with 680 pg gfp mRNA, mRNA of each indicated Wnt activator (20 pg wnt3a, 50 pg β-catΔN and 80 pg vp16-Tcf3ΔN) and mRNA of each indicated Wnt activator plus 600 pg gpx4b mRNA at 12.5 hpf are shown in A. Quantitative results are shown in B. The frequency of embryos with the indicated phenotypes is shown in A. (C) Gpx4b inhibits Wnt activity induced by each indicated Wnt activator in vivo. Embryos were injected with TOPFlash reporter DNA with the indicated mRNAs (20 pg wnt3a, 50 pg β-catΔN, and 80 pg vp16-Tcf3ΔN). (D) Maternal loss of Gpx4b synergistically elevated β-catΔN- and vp16-tcf3ΔN-induced expression of boz, chd and sqt at 4.3 hpf. One-cell stage wild-type and maternal mutant embryos were injected with gfp (40 pg), β-catΔN (25 pg) or vp16-tcf3ΔN (40 pg) mRNA. The injected embryos were raised to 4.3 hpf and the expression levels of the indicated target genes were measured by qRT-PCR. (E,F) Knockdown of GPX4 synergistically enhances Wnt3a- and VP16-Tcf3ΔN-induced Wnt reporter activity. The indicated plasmid DNA (5 ng) was co-transfected with TOPFlash plasmid DNA into control or GPX4-knockdown HEK293T cells and the luciferase activity was measured. Results are from three independent experiments. Values are means±s.e.m. (n=3). *P<0.05; **P<0.01; ***P<0.001. Unpaired t-test, two-tailed. Scale bars: 200 µm. |
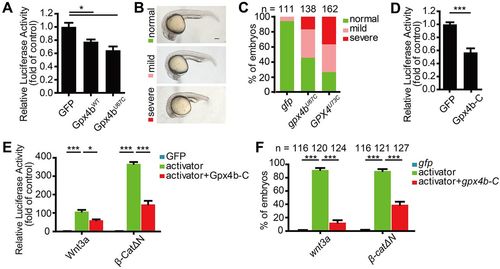
Sec is dispensable for Wnt inhibition. (A) Gpx4bWT and Gpx4bU67C inhibit endogenous Wnt activity. The indicated plasmid DNA (200 ng) was co-transfected with TOPFlash plasmid DNA into HEK293T cells. (B) Classification of ventralized phenotypes at 24 hpf caused by forced expression of 600 pg gpx4bU67C or GPX4U73C mRNA. (C) Percentages of embryos in each category as shown in B. Results are from three independent experiments and the total embryo numbers are given at the top. (D) Gpx4b-C inhibits endogenous Wnt activity. The indicated plasmid DNA (600 ng) was co-transfected with TOPFlash plasmid DNA into HEK293T cells and the luciferase activity was measured. (E) Gpx4b-C inhibits Wnt3a and β-CatΔN activity in vitro. The indicated plasmid DNA (20 ng Wnt3a and 50 ng β-CatΔN) was co-transfected with TOPFlash plasmid DNA into HEK293T cells and the luciferase activity was measured. (F) Gpx4b-C inhibits Wnt3a and β-CatΔN action in vivo. Quantitative results are shown as in Fig. 5B. Embryos injected with 650 pg gfp mRNA, mRNA of each indicated Wnt activator (20 pg wnt3a and 50 pg β-catΔN) and mRNA of each indicated Wnt activator plus 600 pg gpx4b-c mRNA at 12.5 hpf. The total embryo numbers from three independent experiments are shown at the top of each bar. Values are mean±s.e.m. (n=3). *P<0.05; ***P<0.001. Unpaired t-test, two-tailed. Scale bar: 200 µm. |
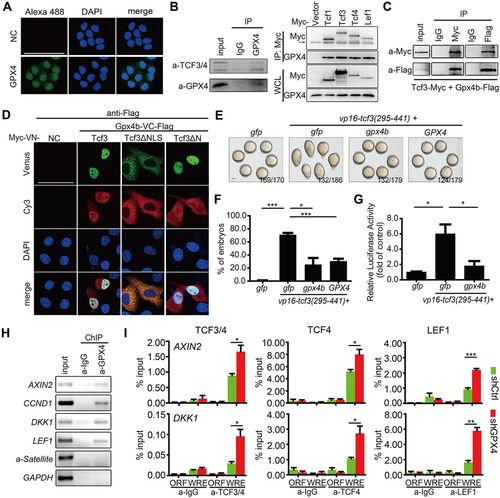
GPX4/Gpx4b binds to and prevents Tcf/Lef binding to target promoters. (A) Distribution of endogenous GPX4 protein in HeLa cells, visualized by immunofluorescence (green) with an anti-GPX4 antibody. Nuclei (blue) were stained with DAPI. Scale bar: 75 μm. (B) Endogenous GPX4 interacts with Tcf/Lef members, as indicated by co-immunoprecipitaton. Left panel: GPX4 interacts with TCF3/4 in HEK293T cells. Right panel: four Myc-tagged Tcf/Lef members interact with endogenous GPX4 in HEK293T cells. The indicated proteins were immunoprecipitated or detected using appropriate antibodies. Vector, empty expressing plasmid with myc tag; WCL, whole-cell lysate; IP, immunoprecipitate; input, positive control; IgG, negative control; arrow, IgG heavy chain. (C) Exogenous Gpx4b interacts with Tcf3. Proteins were extracted from lysates of cells that co-expressed tagged Tcf3 and Gpx4b, immunoprecipitated and subjected to western blot analysis using the indicated antibodies. (D) Gpx4b interacts with each indicated form of Tcf3 in living cells, as indicated by BiFC assay. Flag-tagged Gpx4b-VC expression vector was co-transfected with the indicated forms of Tcf3-VN. Expression of Gpx4b detected by anti-Flag antibody immunostaining (red). NC, negative control. Scale bar: 50 μm. (E,F) Zebrafish Gpx4b and human GPX4 inhibit VP16-Tcf3(295-441) action in vivo. One-cell stage wild-type embryos were injected with indicated mRNAs [680 pg gfp mRNA alone or 80 pg vp16-tcf3(295-441) plus 600 pg gfp, gpx4b or GPX4 mRNA]. Representative images of each group of injected embryos at 12.5 hpf are shown in E. Quantitative results of the indicated phenotypes are shown in F. The frequency of embryos with the indicated phenotypes is shown in E. Scale bar: 200 μm. (G) Gpx4b inhibits VP16-Tcf3(295-441)-induced activity in vivo. Embryos were injected with TOPFlash reporter DNA with the indicated mRNAs [680 pg gfp mRNA alone or 80 pg vp16-tcf3(295-441) plus 600 pg gfp or gpx4b mRNA]. (H) Endogenous GPX4 is associated with the promoters of the indicated direct Wnt target genes in HEK293T cells, as indicated by ChIP assay. α-Satellite and GAPDH promoters were used as negative controls. (I) Knockdown of GPX4 enhances the binding of TCF3/4, TCF4 alone and LEF1 to the AXIN2 and DKK1 promoters in HEK293T cells. Values are means±s.e.m. (n=3). *P<0.05; **P<0.01; ***P<0.001. Unpaired t-test, two-tailed. |
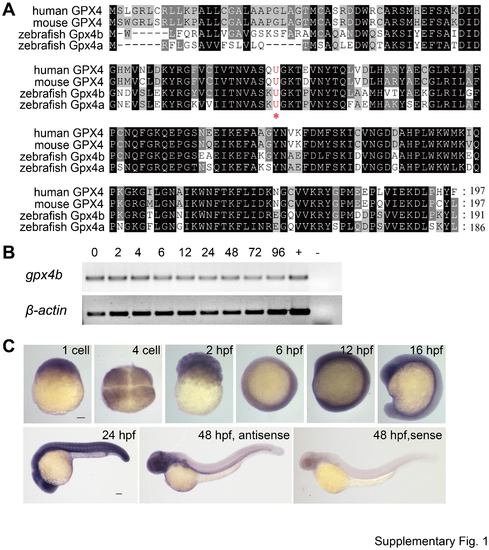
Amino acid sequence alignment of GPX4/Gpx4 and spatiotemporal expression pattern of zebrafish gpx4b. (A) Amino acid sequence alignment of human, mouse, and zebrafish GPX4/Gpx4. Identical amino acids are indicated in black and similar amino acids are indicated in grey. The Sec residue (U) is indicated with an asterisk and highlighted in red. The accession numbers are as follows: human GPX4 NP_002076.2, mouse GPX4 NP_032188.3, zebrafish Gpx4b NP_001025241.2, zebrafish Gpx4a NP_001007283.2. (B) RT-PCR analysis of zebrafish gpx4b mRNA at the indicated embryonic stages. Numbers indicate different developmental stages as hours post fertilization (hpf). β-actin was used as internal control. +, positive control; -, negative control. (C) Whole-mount in situ hybridization analysis of zebrafish gpx4b mRNA at the indicated stages. Panels are dorsal, top, or lateral views with animal pole up or anterior to the left. Scale bars = 200 μm. |

Knockdown of gpx4b results in dorsalized embryos and loss of gpx4b upregulates the expression of gpx4a. (A) Effectiveness of the MO used. Fluorescence micrographs of zebrafish embryos at 12 hpf injected with the gpx4b-5'-UTR reporter plasmid DNA (50 pg) and control MO (cMO, 4 ng) or gpx4b-targeting MO (MO, 4 ng). (B) Validation of the Gpx4b expression plasmid used. Top: Schematic representation of the constructed expression plasmid. A Flag tag was inserted just before the stop codon of the ORF. Bottom: Western blot showing the expression of Flag-tagged Gpx4b. The Flag-tagged Gpx4b expression vector was transfected into HEK293T cells, and lysates were analyzed by immunoblotting with an anti-Flag antibody. GFP expression vector was used as a negative control. (C) Classification of phenotypes caused by MO-mediated knockdown of gpx4b. Representative images of zebrafish embryos at 26 hpf injected with 6 ng control MO (cMO), 6 ng MO, or 6 ng MO plus 50 pg gpx4b mRNA (MO+gpx4b). Lateral views with anterior to the left. Scale bar = 200 μm. (D) Percentages of embryos in each category as shown in C. (E) The antagonizing effect of Gpx4a to gpx4b knockdown in zebrafish embryos. One-cell stage embryos were injected with 6 ng gpx4b MO alone or 6 ng gpx4b MO plus 50 pg gpx4a mRNA. The phenotypes of injected embryos were scored and presented following the criteria shown in C. The results are from three independent experiments and the total embryo numbers are given at the top. (F) The transcript levels of gpx4a and gpx4b in gpx4b WT (WT and cMO), mutant (M and MZ), and morphant (MO) embryos at indicated stages. 6 ng cMO or gpx4b MO were injected at one-cell stage. Each group of embryos were raised and collected at indicated stage, the transcript levels of gpx4a and gpx4b were then measured by qRT-PCR. Values are means±s.e.m. (n = 3). *P < 0.05; **P < 0.01; ***P < 0.001; n.s., not significant. Unpaired t test, Two-tailed. |

Dorsoventral and anteroposterior patterning in gpx4b M and MZ mutants and morphants. (A) Expression of dorsal organizer markers in Mallele2 and MZallele2 mutants compared to WT embryos at 4.3 hpf as revealed by WISH. Upper panels are animal pole views with dorsal to the right. Arrows indicate the edges of the chd and gsc mRNA expression domains. Lower panels are dorsal views with animal pole up. (B) Quantification of the arc of marker Development 144: doi:10.1242/dev.144261: Supplementary information Development • Supplementary information expression shown in A. (C) Effects of gpx4b knockdown on the expression of the indicated dorsal organizer marker genes at 4.3 hpf as revealed by WISH. (D) Quantification of the arc of marker expression shown in C. (E,F) Expression of the indicated dorsoventral markers in M and MZ mutants at 6 hpf as revealed by WISH. (G) Quantification of the arc of each marker expression shown in E and F. (H) Expression of the indicated dorsoventral markers in gpx4b morphants compared to cMO injected embryos at 6 hpf as revealed by WISH. (I) Quantification of the arc of marker expression shown in H. (J) Expression of the indicated anteroposterior neural markers in gpx4b mutants at 12.5 hpf. The frequency of embryos with the indicated pattern is shown in the bottom right corner of each group. Total embryo numbers are given at the top of each bar in B, D, G, and I. Asterisk and arrow in panels indicate the edges of the indicated mRNA expression domains. t, top view with dorsal to the right; d, dorsal views with animal pole up; l, lateral view with dorsal to the right. Values are means±s.e.m. (n = 3). ***P < 0.001. n.s., not significant. Unpaired t test, Two-tailed. Scale bar = 200 μm. |
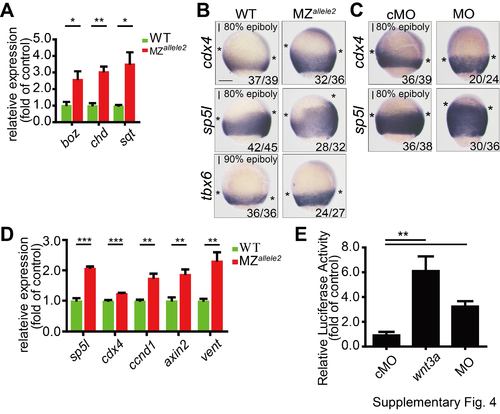
Wnt activity in gpx4b MZ allele2 mutants and morphants. (A) The expression of boz, chd, and sqt mRNA in each indicated group of embryos at 4.3 hpf as analyzed by qRT-PCR. (B) Expression of direct zygotic Wnt markers cdx4, sp5l, and tbx6 in MZallele2 mutants compared to WT embryos at 9 hpf as revealed by WISH. (C) Effects of gpx4b knockdown on the expression of cdx4 and sp5l at 9 hpf as revealed by WISH. The frequency of embryos with the indicated patterns is shown in the bottom right corner of each panel. Asterisks indicate the edges of the indicated mRNA expression domains. l, lateral views with dorsal to the right and animal pole up. (D) The mRNA expression levels of indicated zygotic Wnt direct target genes in WT and MZallele2 mutant embryos at 8 hpf analyzed by qRT-PCR. (E) Knockdown of gpx4b increased Wnt/β-catenin reporter activity. One-cell stage embryos were injected with TOPFlash reporter DNA together with cMO (6 ng), MO (6 ng), or 50 pg wnt3a mRNA. Values are means ±s.e.m. (n = 3). *P < 0.05; **P < 0.01; ***P < 0.001. Unpaired t test, Two-tailed. Scale bar = 200 μm. |
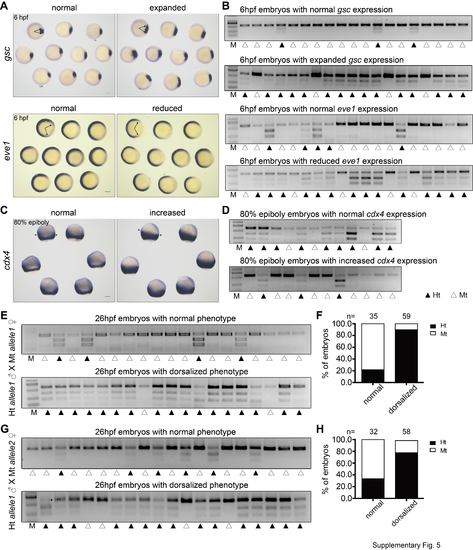
Dorsoventral patterning and Wnt activity in gpx4b mutants assessed by genotyping. (A) Representative expression of gsc and eve1 in progeny of allele1 homozygous female cross to heterozygous males at 6 hpf as revealed by WISH. Animal pole views with dorsal to the right. Arrows indicate the edges of the gsc and eve1 mRNA expression domains. (B) Genotyping results of individual embryos with indicated expression domain as shown in A. (C) Representative expression of cdx4 in progeny of allele1 homozygous female cross to heterozygous male at 80% epiboly as revealed by WISH. Asterisks indicate the edges of the cdx4 mRNA expression domains. (D) Genotyping results of individual embryos with indicated expression domain as shown in C. (E) Genotyping results of individual embryos with representative normal and dorsalized phenotypes (according to Figure 1D). (F) Quantification of genotyping results shown in E. (G) Genotyping results of individual embryos with representative normal and dorsalized phenotypes (according to Figure 1D). (H) Quantification of genotyping results shown in G. n = 5 females for allele1, n = 3 females for allele2. Scale bar = 200 μm. M, marker; Ht, heterozygous mutant; Mt, homozygous mutant. |