
- Title
-
Notch signalling restricts inflammation and serpine1 expression in the dynamic endocardium of the regenerating zebrafish heart.
- Authors
- Münch, J., Grivas, D., González-Rajal, Á., Torregrosa-Carrión, R., de la Pompa, J.L.
- Source
- Full text @ Development

The endocardium expands at the injury site. (A) ET33-mi60a transgenic zebrafish heart, whole-mount views. Strong GFP expression is apparent in the cryoinjured region of the ventricle (arrowheads). (B) ET33-mi60a heart section. Immunohistochemistry (IHC) shows GFP+ endocardial cells in a myosin heavy chain (MF20)− area. (C) ET33-mi60a heart consecutive section to Fig. 1B showing GFP ISH. (D-F) IHC, or IHC combined with FISH. GFP+ cells express Erg (D), nfatc1a (E) and Aldh1a2 (F). (B-F) Boxed areas are magnified on the right. (G-I) Volume rendering of ET33-mi60a;myl7:mRFP injured ventricles. Endocardium, green; myocardium, magenta. (J,J′) Volume rendering (J) and amplified optical section from the centre (J′) of an injured ventricle. (K) Imaris-based volume quantification. The volume of the mRFP− region was determined (blue, Vinjury site) and used as a mask to label GFP+ cells in this region (yellow) and determine their volume (VGFP cells). (L) Scatter plot showing the relative volume occupied by GFP+ cells in the injury site. Mean (red line)±s.d.; one-way ANOVA and Newman-Keuls test (see Table S3). (M) IHC showing Pcna+ GFP+ endocardial nuclei (arrowheads). Boxed areas magnified beneath. (N) Scatter plot showing percentage of Pcna+ cells among GFP+ cells within and adjacent (50 μm) to the injury site. Mean±s.d.; one-way ANOVA and Newman-Keuls test, *P<0.05, ***P<0.005 (see Table S4). (O) Schematic illustrating that endocardium proliferation precedes endocardial expansion at the injury site. is, injury site; a, atrium; ba, bulbus arterious. Dotted lines demarcate injured tissue. Scale bars: 200 μm in A-C,G-J; 20 μm in D-F; 100 μm in M; 50 μm in magnified views in B,C; 20 μm in magnified views in D,E,M; 100 μm in J. |
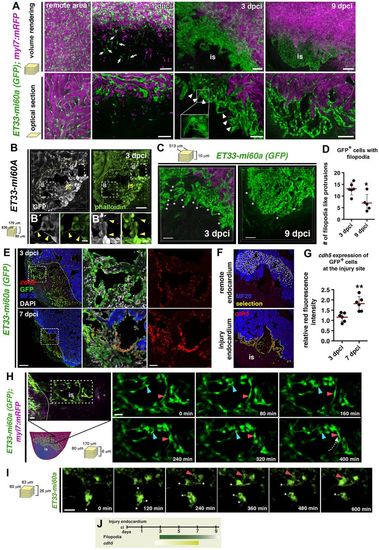
Characteristics of injury endocardium at different stages of regeneration. (A) Volume rendering and corresponding optical sections of part of the remote and injured region from ET33-mi60a;myl7:mRFP hearts. Remote region contains elongated and coherent GFP+ cells. At 1 dpci individual GFP+ cells are seen at the injury site (is) (arrows). At 3 dpci, dense, clustered endocardial cells with filopodia-like protrusions (arrowheads) are observed. At 9 dpci the endocardial cells are more organised, aligned and mostly lack filopodia-like protrusions. (B-B″) Vibratome section of ET33-mi60a heart stained for GFP and with phalloidin (for F-actin). Filopodia-like protrusions of wound endocardial cells show phalloidin staining (arrowheads). (C) Volume rendering of part of the injured region from ET33-mi60a;myl7:mRFP hearts. (D) Quantification of filopodia-like protrusions from comparable 3D images. Mean±s.d.; t-test, *P<0.05. (E) FISH combined with IF showing high cdh5 expression (red) in GFP+ wound endocardium. Boxed areas magnified on the right. (F,G) cdh5 (red) fluorescence intensity measurements with ImageJ software: GFP+ endocardium was selected (F, yellow) in the remote or wound region. Scatter plot (G) showing relative red fluorescence intensity comparing values of both regions. Mean±s.d.; t-test, **P<0.01. (H,I) Confocal still pictures from time-lapse movies (Movies 9, 10) of wound endocardial cells in cultured ET33-mi60a;myl7:mRFP hearts. The box in the schematic indicates the imaging region. Endocardial cells move (H,I, red arrowheads) and change their position (H, blue arrowhead). Dotted arrow (H) indicates the direction of cell migration. Endocardial cells present dynamic filopodia-like protrusions (I, asterisks). (J) Schematic showing wound endocardium characteristics. Filopodia-like protrusions are more abundant at early (3 dpci) than at later (9 dpci) phases. cdh5 expression increases when regeneration proceeds. Scale bars: 50 μm in A-C; 100 μm in E; 20 μm H,I; 10 μm in magnified views of B. |
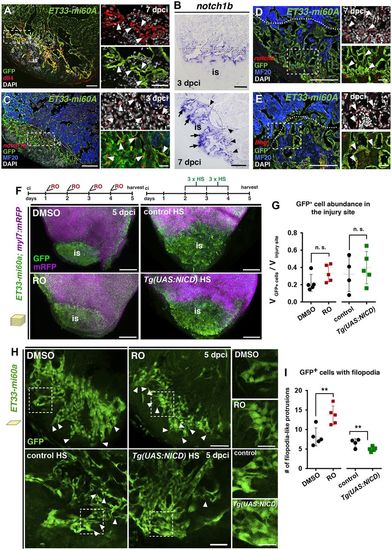
Notch signalling elements are expressed in the endocardium and Notch signalling modulation affects injury endocardium maturation. (A) IHC showing Dll4 expression by GFP+ wound endocardial cells (arrowheads). (B) ISH showing notch1b expression in endocardial cells at the injury site (arrows) and lining injury-adjacent cardiomyocytes (arrowheads). (C-E) FISH for notch1b (C), notch2 (D) or lfng (E) combined with IHC showing transcripts in GFP+ wound endocardial cells (arrowheads). (F) Volume rendering of injured ET33-mi60a;myl7:mRFP ventricles after DMSO or RO treatment and of heat shocked (HS) Tg(UAS:NICD);ET33-mi60a;myl7:mRFP and control hearts. Treatment regimens are indicated at the top. (G) Scatter plot presenting relative wound GFP+ cell volume. Mean (dotted line)±s.d.; t-test. (H) Injury site optical sections showing the disorganisation and clustered appearance of endocardial cells and more filopodia-like protrusions (arrowheads) after RO treatment, and fewer filopodia-like protrusions after heat shock in Tg(UAS:NICD);ET33-mi60a;myl7:mRFP hearts. (I) Scatter plot showing the number of filopodia-like protrusions. For representative images used for quantification see Fig. S6A. Mean±s.d.; t-test **P<0.05. Dotted lines (A,C,D,E) delineate the injury site (is). Boxed areas are magnified on the right. Scale bars: 100 µm in A-E; 200 µm in F; 50 µm in H; 20 µm in magnified views in A,C,D,E; 25 µm in magnified views in H. EXPRESSION / LABELING:
|
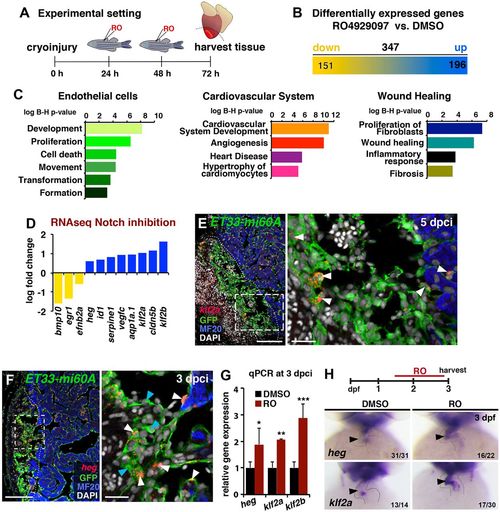
Notch inhibition affects developmental and injury-related endocardial/endothelial genes. (A) RO injection and RNA extraction procedure from the ventricular apex (below the dotted line). (B) RNA-seq detected 347 genes differentially expressed in injured hearts after RO treatment (fold change >0.5, P<0.05). (C) Ingenuity-based RNA-seq data analysis. The charts represent selected Ingenuity categories affected. (D) RNA-seq revealed differential cardiac expression of endothelial genes at 3 dpci in RO- or DMSO-treated fish. Yellow, downregulated; blue, upregulated. (E,F) FISH against klf2a (E) or heg (F) combined with IHC. Mosaic expression of both genes was observed in wound and wound-adjacent GFP+ endocardial cells (arrowheads). Boxed areas are magnified on the right. (G) qPCR analysis of heg, klf2a and klf2b expression in injured hearts. Mean±s.d.; t-test, *P<0.05, **P<0.01, **P<0.005. (H) ISH in embryos at 3 days post fertilisation (dpf). RO treatment (regime indicated at top) expanded ventricular expression of heg and klf2a (arrowhead). Dotted lines delineate injury site. The number of embryos displaying the illustrated phenotype among the total number examined is indicated. Scale bars: 100 µm in E,F; 20 µm in magnified views in E,F. EXPRESSION / LABELING:
PHENOTYPE:
|
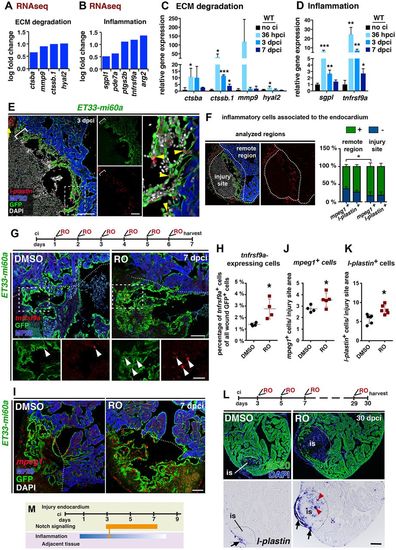
Notch signalling inhibition affects inflammatory gene expression and macrophage abundance. (A,B) RNA-seq analysis. Differential cardiac expression of genes related to ECM remodelling (A) and inflammation (B) in RO-treated fish at 3 dpci. (C,D) qPCR analysis of hearts with no cryoinjury (no ci) and at indicated time points following cryoinjury. Mean±s.d.; t-test, *P<0.05, **P<0.01, ***P<0.005. (E) FISH combined with IHC, showing l-plastin+ cells (arrowheads) in contact with GFP+ cells. l-plastin+ cell accumulations at the injury site locally coincide with high endocardial cell abundance (brackets). (F) The percentage of mpeg1-expressing or l-plastin-expressing inflammatory cells that contact (green) or do not contact (blue) endocardial cells at the injury site or remote region. Inflammatory cells at the outer epicardial region were not considered. (G) tnfrsf9a FISH combined with IHC. RO-treated hearts (regime indicated at top) show more GFP+ cells expressing tnfrsf9a. (H) Scatter plot showing percentage of tnfrsf9a+ endocardial cells. Mean±s.d.; t-test, *P<0.05. (I) mpeg1 FISH combined with IHC. RO treatment (regime in G) increased mpeg1+ macrophage abundance associated with the GFP+ endocardium. (J,K) Scatter plots of the number of mpeg1+ (J) or l-plastin+ (K) macrophages related to the area occupied by GFP+ cells. Only macrophages contacting GFP+ endocardial cells were considered. Mean±s.d.; t-test, *P<0.05. (L) MF20 IHC and l-plastin ISH on consecutive heart sections. RO treatment increased the numbers of l-plastin+ macrophages inside the MF20− injury site (red arrowheads). l-plastin+ macrophages in the outer region of the injury can be seen in both conditions (arrows). (M) Schematic showing time and intensity of the inflammatory response and Notch signalling activation at the injury site. Dotted lines delineate the injury site (is). Scale bars: 100 µm, except 50 µm in magnified views. |

Notch signalling regulates cardiomyocyte proliferation. (A) ET33-mi60a;myl7:mRFP ventricle, volume rendering and optical section of a region of the inner injury border. Endocardial cells surround injury-adjacent cardiomyocytes (arrows) and precede into the wound. (B) IHC showing endocardial cells (GFP+) in contact with myocardial protrusions (tropomyosin+; blue arrowheads). (C,D) IHC against BrdU and Mef2 (C). Heat shock regime is indicated at the top. Scatter plot (D) of percentage of BrdU+ wound-adjacent cardiomyocytes (Mef2+; arrowheads between dotted lines). Mean±s.d.; t-test,**P<0.01. (E,F) Mef2 IHC showing a higher density of wound-adjacent cardiomyocytes (between the dotted lines) in Tg(UAS:NICD) than in control hearts (E), as quantified in F. Mean±s.d.; t-test, *P<0.05. (G) ISH showing higher numbers of nkx2.5+ wound-adjacent cardiomyocytes (between dotted lines) in Tg(UAS:NICD) hearts. (H) RNA-seq data showing differential myocardial gene expression in RO-treated hearts at 3 dpci. (I) ISH showing mycb expression in injury-adjacent cardiomyocytes (arrowheads) in DMSO-treated but not in RO-treated hearts (asterisks). (J) qPCR levels of fosab in the injured heart. Mean±s.d.; t-test, *P<0.05. LOF, loss of function. (K) MF20 IHC and mylk3 ISH on heart sections. RO treatment decreased the numbers of mylk3− cardiomyocytes adjacent to the injury site (arrowheads). (L) Scatter plot showing the percentage of mylk3− wound-adjacent (50 µm) cardiomyocytes. Mean±s.d.; t-test, **P<0.01. (M) qPCR analysis of mylk3 and tcap levels in the injured heart. Mean±s.d.; t-test, ***P<0.001. GOF, gain of function. Dotted lines delineate the injury site (is). Boxed areas are magnified in insets. Scale bars: 100 µm, except 25 µm in magnified views. |

serpine1 is upregulated early upon cryoinjury and responds to Notch in endocardial/endothelial cells. (A) qPCR analysis of serpine1 in hearts with no cryoinjury (no ci) and at indicated time points following cryoinjury. Mean±s.d.; t-test, *P<0.05. (B) serpine1 qPCR in the injured heart. Mean±s.d.; t-test, *P<0.05. (C) serpine1 FISH plus IHC. At 36 hpci, numerous wound and wound-adjacent GFP+ endocardial cells express serpine1. At 3 and 7 dpci, serpine1-expressing wound endocardial cells are less frequent. Boxed areas are magnified beneath. (D) Scatter plot of the percentage of serpine1+ cells among all wound and wound-adjacent (50 μm) GFP+ cells. Mean±s.d.; one-way ANOVA and Newman-Keuls test, ***P<0.005 (see Table S5). (E) serpine1 FISH combined with IHC. RO-treated hearts (regime indicated at top) show more GPF+ cells expressing serpine1 (arrowheads). (F) Scatter plot indicating the percentage of serpine1+ endocardial cells. Mean±s.d.; t-test, *P<0.05. (G) Log fold change (FC) of serpine1 showing increased expression as assessed by qPCR in RO-treated PAVECs, by RNA-seq in RO-treated zebrafish hearts and in various murine models of endocardial Notch disruption. (H) IF indicating Pcna+ and GFP+ cells after TP treatment (regime indicated at top). (I) Scatter plot of the relative number of Pcna+ cells among all wound and wound-adjacent GFP+ cells. Mean±s.d.; t-test, *P<0.05. (J) FISH combined with IHC showing that TP treatment increases cdh5 mRNA levels in GFP+ wound endocardium. (K) Scatter plot of relative red fluorescence intensity, comparing values of remote and wound endocardium (see Fig. 2F). Mean±s.d.; t-test, **P<0.01. (L) IF revealed more Pcna+ Mef2+ wound-adjacent cardiomyocytes (arrowheads) after TP treatment. (M) Scatter plot of the relative number of Pcna+ cells among all wound-adjacent (100 µm) Mef2+ cardiomyocytes. Mean±s.d.; t-test, **P<0.01. (N) AFOG-stained hearts, treated with DMSO or TP (treatment regime indicated at top). (O) Scatter plot indicating injury site size (mean±s.d.). Dotted lines delineate injury site. Scale bars: 100 µm in C,E,H,J,L; 200 µm in N; 20 µm in magnified views. |

Activated endocardium in the injury site (A) IHC against ERG, GFP and MF20 on sections of ET33-mi60a transgenic hearts (7 dpci), showing GFP+ endocardial/endothelial cells within and lining the injury site (is) (white arrowheads). The boxed area is magnified in the right-hand panel. (B) ISH against nfatc1a at 7 dpci, showing strong expression within the injury site (is). (C) IHC against GFP on sections of Tg(fli1a:GFP) transgenic hearts (3 dpci) showing endocardial cells at the injury site. The boxed area is magnified in the right-hand panel. (D) Scatter plot showing the relative volume occupied by GFP+ cells in a selected region of the remote region and the injury site at 24 hpci. Values of endocardial volume at the injury site are also represented in Figure 1L (black line = mean ± s.d, t-test, ***P<0.005). (E) Volume rendering of injured ventricles of ET33mi-60A; myl7mRFP hearts, with endocardium labelled green and myocardium magenta, at indicated time points. Volume rendering movies are available in the expanded view section. (F) Scatter plot showing the evolution of injury-site volume after cryoinjury in ET33-mi60a; myl7:mRFP transgenic hearts, quantified with IMARIS. (G-I) IHC against GFP and Pcna on sections of ET33-mi60a transgenic hearts (no ci, 3 dpci, 5dpci), showing almost any Pcna-expressing endocardial cell in the non-injured heart but high abundance of proliferating cells within the injury site (is) at 3 and 5 dpci (white arrowheads). The boxed area is magnified in the right hand panel. The dotted lines demarcate the injured tissue. Scale bars: 50 µm in A; 200 µm in B, E; 100 µm in C, G, H, I; 5 µm in magnified views in A, 100 µm in B, 20 µm in C,G, I. |
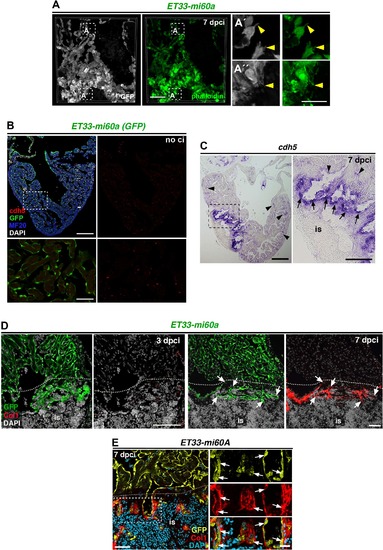
The injury endocardium exhibits filopodia-like protrusions and high levels of cdh5 (A) Vibratome section of ET33-mi60A heart, immune-stained for GFP and with phalloidin (7 dpci). Filopodia-like protrusions of wound endocardial cells show phalloidin staining (A', A'', arrowheads) (B) cdh5 FISH combined with IF showing low levels of cdh5 levels (red) in GFP+ endocardial cells all over the ventricle. (C) ISH against cdh5 at 7 dpci, showing strong expression within the injury site (is, arrow) and weak expression in the remote region (arrowheads). Boxed areas are magnified below or on the right. (D, E) IHC against GFP and Col1 on sections of ET33-mi60a transgenic hearts, showing low Col1 signal at 3 dpci (B) and similar distribution of endocardial cells and col1 at the inner injury border (dotted line) at 7dpci (C, white arrowheads). Scale bars: 50 µm in A, E; 200 µm in B, C; 100 µm in D, 25 µm in magnified views in A, E, 50 µm in B, C. EXPRESSION / LABELING:
|

Genes encoding Notch signalling elements are expressed in endocardial cells upon cryoinjury (A) IHC of Dll4 and MF20, showing expression within the injury site (is) and surrounding adjacent cardiomyocytes. The boxed area is magnified in the panel below. (B) ISH for notch1b, showing low notch1b expression in the injury site and the remote region at 36 hpci. The dotted line demarcates the injury site (is). (C, D) ISH of lfng, notch2 and notch3 in regenerating hearts, showing expression adjacent to and within the injury site (is; 3 dpci, 7 dpci). Boxed areas are shown at higher magnification in the lower row. (E) IHC against Dll4 and GFP on sections of Tg(fli1a:GFP) transgenic hearts (7 dpci), showing endocardial expression of Dll4 (white arrowheads). The dotted line demarcates the injury site (is). (F) FISH against notch1b combined with IHC against GFP and MF20 on sections of Tg(fli1a:GFP) transgenic hearts (7 dpci) showing notch1b transcripts in endocardial cells (white arrowheads). The boxed area is magnified in the right-hand panels. The dotted line demarcates the injury site (is). (Scale bars: 200 µm in A, B; 100 µm in C, D, E, F; 50 µm in magnified views in A, D; 20 µm in E, F. EXPRESSION / LABELING:
|
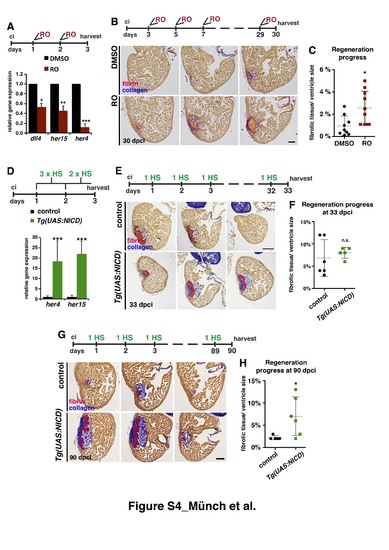
Notch signalling modulation impairs heart regeneration (A) Relative gene expression (qPCR) of the Notch target genes dll4, her15, and her4, showing reduced expression after RO treatment (indicated on top). * P<0.05; **P<0.01; ***P<0.005. (B) Representative AFOG-stained sections from three levels of the hearts of fish treated with DMSO or RO for 30 dpci (treatment regime is indicated on top). Cardiac muscle: brown; fibrin: pink/ orange; collagen: blue. (C) Scatter plot showing the amount of fibrotic tissue relative to ventricle size in hearts from fish treated with DMSO or RO (discontinuous line = mean ± s.d, t-test *P<0.05) (D) qPCR showing higher expression of her4 and her15 in injured hearts of transgenic Tg(UAS:NICD) fish compared than in the control at 3 dpci. (heat shock regime is indicated on top ( mean ± s.d, t-test, ***P< 0.005). (E) AFOG–stained sections taken at 3 anatomical levels of WT and Tg(UAS:NICD) hearts at 33 dpci, showing similar regenerative capacity (heat shock regime is indicated on top). (F) Quantification of the progress of regeneration at 33 dpci (discontinuous line = mean± s.d, t-test, not significant). (G) AFOG-stained sections taken at 3 anatomical levels of WT and Tg(UAS:NICD) hearts at 90 dpci, showing failed regeneration (heat shock regime is indicated on top). (H) Quantification of the progress of regeneration at 90 dpci (discontinuous line = mean, t-test *P<0.05). Scale bars: 100 μm. PHENOTYPE:
|

Notch signalling modulation does not affect aldh1a2 expression or proliferation (A,B) ISH for aldh1a2 on sections of hearts treated with DMSO or RO or from heat-shocked Tg(UAS:NICD) and control fish, showing no differences of expression. RO-treatment and heat shock regimes are indicated on top. (C) IHC against BrdU and GFP on heart sections of ET33-1a transgenic fish (3 dpci), showing BrdU incorporation by GFP+ endocardial cells adjacent to the injury site (is). (D) Quantification of BrdU+/ GFP+ cell ratio in hearts of fish treated with DMSO or RO, indicating no difference in endocardial cell proliferation (mean± s.d, t-test, not significant). (E) IHC against BrdU and GFP on heart sections of ET33-1a transgenic fish alone or crossed with Tg(UAS:NICD) at 3 dpci, showing BrdU incorporation by GFP+ endocardial cells adjacent to the injury site (is). (F) BrdU+/ GFP+ cell ratio in hearts of ET33-1a and Tg(UAS:NICD); ET33-1a transgenic fish, indicating no difference in endocardial cell proliferation (mean± s.d, t-test, not significant). (G) IHC for GFP and mf20 on sections of hearts treated with DMSO or RO or from heat-shocked Tg(UAS:NICD), showing no differences of expression. Boxed areas are magnified on the right. Hearts were treated for 3 days with RO, DMSO or heat shocks. Scale bars: (A) 100 μm in all panels. |

Notch signalling modulation does not interfere with endocardial cdh5-expression (A) Volume rendering of part of the injured region (513 μm x 513 μm x 10 μm) from ET33mi-60A; myl7mRFP hearts after treatment with RO or DMSO and from ET33mi-60A; myl7mRFP, Tg(UAS:NICD) and control hearts. Comparable 3D-images were used for quantification of filopodia- like protrusions. The graph of quantified filopodia is shown in Figure 3I. (B, C) FISH against cdh5 combined with IHC against GFP and mf20 on sections of ET33-mi60a transgenic hearts after treatment with DMOS or RO (7dpci) and of ET33mi-60A;Tg(UAS:NICD) and control hearts ( 3dpci). The treatment regime is indicated on top. GFP+ endocardial/endothelial cells at the injury site present similar levels of cdh5 expression in injured hearts after treatment with RO or DMSO and in ET33mi-60A;Tg(UAS:NICD) or control hearts. (D, E) Scatter plot showing relative red fluorescence intensity, comparing values of the endocardium of the remote region to the injury endocardium (see Figure 2D), in injured hearts (dotted line = mean± s.d, t-test, not significant). Scale bars: 50 μm in A, 100 μm in B, C. |
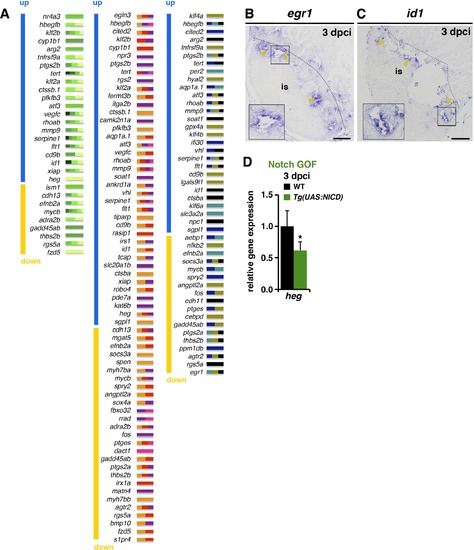
Notch signalling affects endocardial/endothelial gene expression (A) Genes assigned to the three categories in (Figure 4I). Genes are ordered according to their level of differential expression (up-regulated upon RO-treatment, blue; down-regulated, yellow). The colour of small bars indicates the assigned Ingenuity categories (presented in the chart in Figure 4C). (B, C) ISH, showing egr1- and id1- expression at the inner injury border (yellow arrowheads). The boxed area is magnified in inserts. (D) qPCR analysis showing lower heg mRNA levels in Tg(UAS:NICD) transgenic injured ventricles than in control. (mean± s.d., t-test, *P<0.05). Dotted lines delineate the injury site (is). Scale bars: 100 µm. EXPRESSION / LABELING:
|
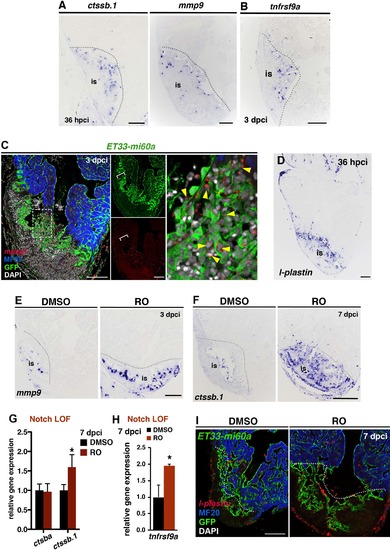
Notch inhibition affects ECM remodelling gene expression and inflammatory processes (A) ISH for ctssb.1 and mmp9, revealing high expression at the inner injury border at 36 hpci. (B) ISH against tnfrsf9a on sections from an injured ventricle at 3 dpci, showing gene expression in cells with endocardial morphology within the injury site. (C) mpeg1- FISH combined with IHC, showing mpeg+ cells (yellow arrowheads) in contact with GFP+ cells. mpeg1+ cell accumulations at the injury site (is) locally coincides with high endocardial cell abundance (brackets). (D) ISH on consecutive sections for l-plastin showing high l-plastin expression in the injury site at 36 hpci. (E) ISH against mmp9 (3 dpci), showing high numbers of positive cells within the injury site (is) of RO-treated hearts. (F) ISH against ctssb.1 (7 dpci), showing high numbers of positive cells within the injury site (is) of RO-treated hearts. (G) qPCR analysis showing increased ctssb.1 mRNA levels in injured ventricles at 7 dpci after RO-treatment. (mean± s.d., t-test, *P<0.05. (H) qPCR analysis of tnfrsf9a expression in ventricles at 7 dpci after treatment with RO or DMSO mean± s.d., t-test, *P<0.05). (I) FISH against l-plastin combined with IHC against GFP and MF20 on sections of ET33-mi60a transgenic hearts (7 dpci) after RO- or DMSO-treatment. ROtreatment results in an increased abundance of l-plastin+ macrophages associated to the endocardium. Dotted lines delineate the injury site (is). Scale bars: 100 μm. |

Notch inhibition decreases cardiomyocyte proliferation (A) IHC against BrdU and Mef2 on heart sections (7 dpci), showing lower BrdU incorporation in Mef2+ cells (white arrowheads) adjacent to the injury (between the dashed lines) after treatment with RO than after treatment with DMSO. (B) Scatter plot showing quantification of BrdU+ Mef2+ cells in DMSO- and RO-treated hearts (discontinuous line = mean ± s.d., t-test, *P<0.05). (C) FISH against hand2 combined with IHC for mf20 showing, hand2-expression in cardiomyocytes. (D) ISH against hand2 at 7 dpci, showing higher numbers of injury-adjacent cardiomyocytes expressing these genes (between the dotted lines) in Tg(UAS:NICD) hearts than in control hearts. Dotted lines delineate the injury site (is). Scale bars: 100 µm; 25 µm in amplified views. |
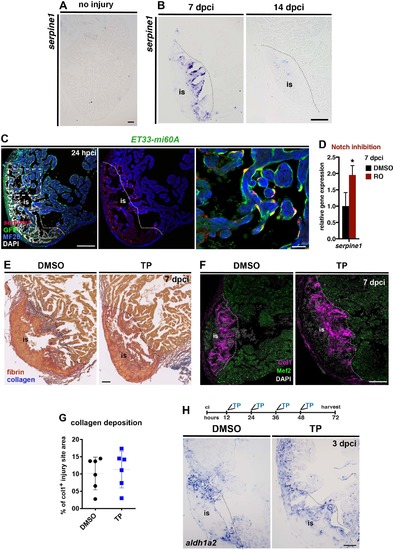
Serpine1 is upregulated in the injury endocardium and its inhibition does not interfere with blood clot or collagen deposition. (A, B) ISH against serpine1, showing no expression in the uninjured heart, moderate levels at 7 dpci but almost no expression at 14 dpci. (C) FISH against serpine1 combined with IHC against GFP and MF20 on sections of ET33-mi60a transgenic hearts at 24 hpci. Serpine1 is strongly expressed in GFP+ endocardial cells adjacent and within the injury site but not in remote regions at 24 hpci. The boxed area is magnified on the right hand panel. (D) qPCR analysis showing higher serpine1 mRNA levels in injured ventricles at 7 dpci in RO-treated fish than in DMSO-treated fish (mean± s.d., t-test, *P<0.05). (E) AFOG stained TP- or DMSO treated hearts indicating similar fibrin deposition at the injury site (is) in both groups at 7dpci. (F) IHC for collagen 1 (Col1) and Mef2 showing similar amount of collagen at the injury site upon TP or DMSO-treatment. (G) Scatter plot showing the area covered by collagen relative to the injury site area in hearts treated with TP or DMSO. (dotted line = mean± s.d, t-test, not significant). (H) ISH in hearts treated with TP or DMSO (regime is indicated on top) showing similar expression of aldh1a2 in the injury endocardium. Dotted lines delineate the injury site (is). Scale bar: 100 µm; 20 µm in the amplified view in C. |