
- Title
-
Zebra Fish Lacking Adaptive Immunity Acquire an Antiviral Alert State Characterized by Upregulated Gene Expression of Apoptosis, Multigene Families, and Interferon-Related Genes
- Authors
- García-Valtanen, P., Martínez-López, A., López-Muñoz, A., Bello-Perez, M., Medina-Gali, R.M., Ortega-Villaizán, M.D., Varela, M., Figueras, A., Mulero, V., Novoa, B., Estepa, A., Coll, J.
- Source
- Full text @ Front Immunol
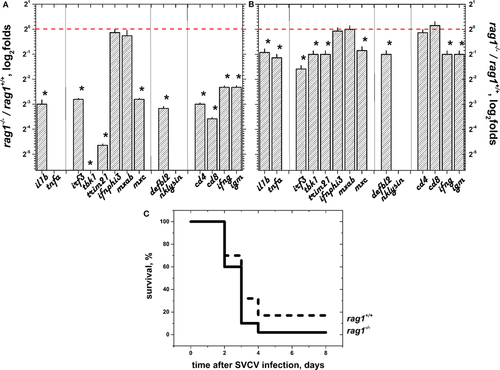
Selected gene sets (sGS) were downregulated in rag1−/− egg embryos but were similar in early hatched larvae and both showed high mortalities when infected by spring viremia carp virus (SVCV). (A) Expression folds in embryo eggs 1 day after fertilization (n = 60). Reverse transcriptase and quantitative polymerase chain reaction data were first normalized by the formula, expression of each gene/expression of ef1a. Differential folds were then calculated by the formula, normalized expression of each rag1−/− gene/normalized expression of each rag1+/+ gene. Tbk1 fold was lower than 2−6 (not shown). Tnfa and nklysin were not done. Red dashed line, onefold boundary. *Statistically different from onefold with p < 0.05 by the t-test. (B) Expression folds in hatched larvae 3 days after fertilization (n = 45) calculated as in (A). (C) Kaplan–Meier survival curves of naïve rag1−/− (n = 90) and rag+/+ (n = 90) recently hatched larvae after bath infection in 104 pfu of SVCV per ml (n = 2) at 22°C (optimal replication for SVCV). Differences between rag1−/− and rag+/+ survival curves of SVCV-infected larvae as determined by the Gehan–Breslow–Wilcoxon test were significant with p < 0.05 (*). Solid lines, rag1−/− larvae. Dashed lines, rag+/+ larvae. EXPRESSION / LABELING:
|
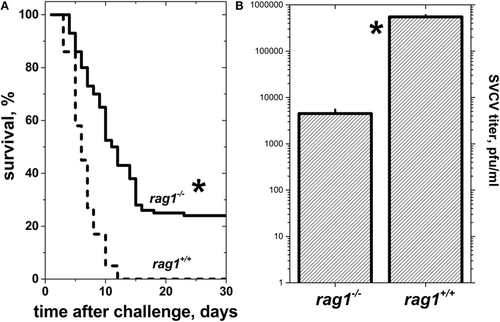
Naïve adult rag1−/− zebra fish are more resistant to lethal spring viremia carp virus (SVCV) infection than rag1+/+ zebra fish. (A) Kaplan–Meier survival curves of naïve rag1−/− (n = 84) and rag+/+ (n = 100) adult zebra fish after exposure to a lethal dose of 104 pfu/ml of SVCV under the same challenge conditions as in panel (A). *Statistically significant differences between survival curves between rag1−/− and rag+/+ as determined by the Gehan–Breslow–Wilcoxon test with p < 0.05 (n = 2). Solid lines, rag1−/− zebra fish larvae. Dashed lines, rag+/+ zebra fish larvae. (B) SVCV titers from pooled whole zebra fish (n = 4 zebra fish per genotype) 3 days after SVCV infection as determined by plaque forming unit (pfu) assays. PHENOTYPE:
|
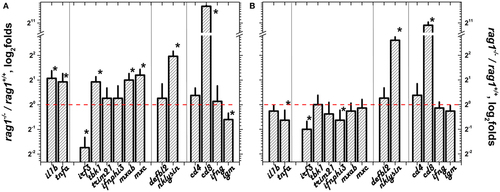
Differential expression in skin/fins of adult zebra fish before and after spring viremia carp virus (SVCV) infection. The transcript differential expression folds of rag1−/−/rag1+/+ adult zebra fish in skin/fins were calculated as in Figure 1: (A) before infection and (B) 3 days after SVCV infection. Means and SDs were represented (n = 4–6 zebra fish). Red dashed line, onefold boundary. *Statistically different from onefold with p < 0.05 by the t-test. |
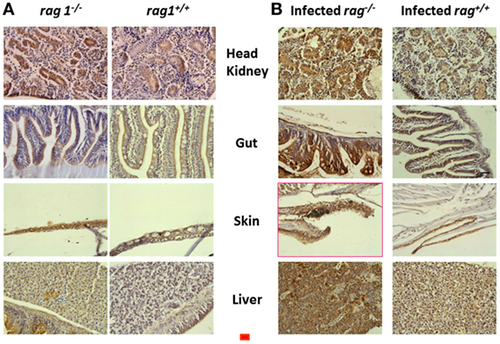
Active CASPASE-3 staining in different tissues from uninfected and spring viremia carp virus (SVCV)-infected rag1−/− and rag1+/+ adult zebra fish. Tissue sections from (A) uninfected and (B) SVCV-infected rag1−/− and rag1+/+ adult zebra fish were stained by anti-human active CASPASE-3 antibody. Dark-stained areas in all rag1−/− tissues indicate the presence of active CASPASE-3. Images are representative of at least two independent experiments. Horizontal red line, 30 μm. |
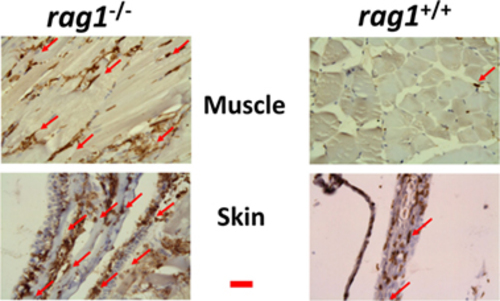
Leukocyte infiltration in muscle and skin tissues in rag1−/− and rag1+/+ adult zebra fish. Histological sections from muscle and skin tissues of rag1−/− and rag1+/+ were stained with an antibody anti-l-plastin, a pan-leukocyte marker (dark-stained areas). Red arrows, examples of l-plastin stained cells. Images are representative of at least two independent experiments. Horizontal red line, 30 μm. PHENOTYPE:
|
PHENOTYPE:
|