
- Title
-
TAp73 suppresses tumor angiogenesis through repression of proangiogenic cytokines and HIF-1α activity
- Authors
- Stantic, M., Sakil, H.A., Zirath, H., Fang, T., Sanz, G., Fernandez-Woodbridge, A., Marin, A., Susanto, E., Mak, T.W., Arsenian Henriksson, M., Wilhelm, M.T.
- Source
- Full text @ Proc. Natl. Acad. Sci. USA

TAp73-deficient cells form larger and more vascularized tumors compared with WT. (A) E1A/RasV12-transformed WT or TAp73−/− MEFs were injected s.c. into nude mice (n = 9/group), tumor growth was measured at a 2-d interval up to 22 d postinjection. Results are shown as the mean ± SEM, P < 0.0001. (B) Increased tumor weight in absence of TAp73 (TAp73−/−, 0.33 ± 0.07 g vs. WT, 0.14 ± 0.045 g; *P < 0.05) Results are shown as the mean ± SD. (C–F) Representative images and quantification of tumor vasculature in WT, TAp73−/−, and ΔNp73−/− tumors using anti-endomucin staining (red) on paraffin sections. In total, n = 14 TAp73−/−, n = 12 TAp73+/+, n = 4 ΔNp73−/−, and n = 4 ΔNp73+/+ tumors were analyzed and five fields/tumor were used for quantification. (G, H, J, and K) Images and quantification of vasculature in spontaneous B-cell lymphoma model in TAp73−/− (n = 3), ΔNp73−/− (n = 3), and WT (n = 3) tumors, using anti-endomucin staining (green) on paraffin sections. Five to 10 fields per tumor were used for quantification (**P < 0.01). (Right) B220 staining indicating all tumors analyzed are of B-cell origin. (I) Tumor cell xenografts into zebrafish embryos. (Left) 48 h postfertilization (hpf) Tg(fli:EGFP) embryos injected with CM-DiI–labeled MEFsE1A/Ras into the perivitelline space. (Middle) Injected embryo stage 72 hpf (20 h after injection) with a positive angiogenic response (arrowhead). (Right) Overlay with grafted cells (red). (L) Quantification of angiogenic response in zebrafish comparing three WT cell lines with three ΔNp73−/− or three TAp73−/− cell lines (all generated from paired litter mates). Results are presented as mean fold change ± SD compared with WT. Cells deficient for ΔNp73 show a reduced angiogenic response compared with WT [0.54 ± 0.06 vs. 1 (WT); ***P < 0.0005]; in contrast, TAp73−/− cells show an enhanced response [1.88 ± 0.35 vs. 1 (WT); *P < 0.05]. EXPRESSION / LABELING:
|
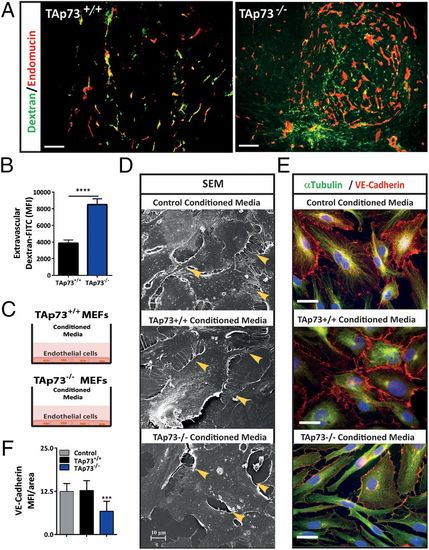
Loss of TAp73 increases tumor blood vessel permeability through reduced endothelial cell–cell contact. (A and B) TAp73+/+ and TAp73−/− tumors perfused with FITC-labeled dextran and stained for endothelial cells (endomucin). Green, FITC-labeled dextran leakage into the extravascular tumor space; red, endomucin staining of blood vessels. Mean fluorescent intensity (MFI) was determined for total dextran-FITC (green) signal with pixel counting; intravascular dextran-FITC (yellow) was subtracted from the final value (n = 5/group, five fields/tumor was used for quantification; ****P < 0.0001). (Scale bar, 100 μm.) (C) Schematic representation of in vitro cell permeability assay. (D) SEM of confluent monolayer HuDMECs treated with CM from hypoxic TAp73+/+ or TAp73−/−MEFsE1A/Ras (Middle and Bottom) or control HuDMEC media (Top). (Top and Middle) Arrow indicating well-defined junctions and cell–cell contact. (Bottom) Breaks in cell–cell contact and gaps between HuDMECs treated with CM from hypoxic TAp73−/−MEFsE1A/Ras. (Scale bar, 10 μm.) (E and F) VE–cadherin (red) immunofluorescence staining and quantification. (Scale bar, 50 μm.) (Top and Middle) HuDMECs treated with control media or CM from hypoxic TAp73+/+ MEFsE1A/Ras present distinct interendothelial VE-cadherin bonds and close cell–cell contact. (Bottom) Interendothelial VE-cadherin bonds are lost, resulting in weakened cell–cell contact in HuDMECs treated with CM from hypoxic TAp73−/− MEFsE1A/Ras. |