
- Title
-
Left Habenula Mediates Light-Preference Behavior in Zebrafish via an Asymmetrical Visual Pathway
- Authors
- Zhang, B.B., Yao, Y.Y., Zhang, H.F., Kawakami, K., Du, J.L.
- Source
- Full text @ Neuron
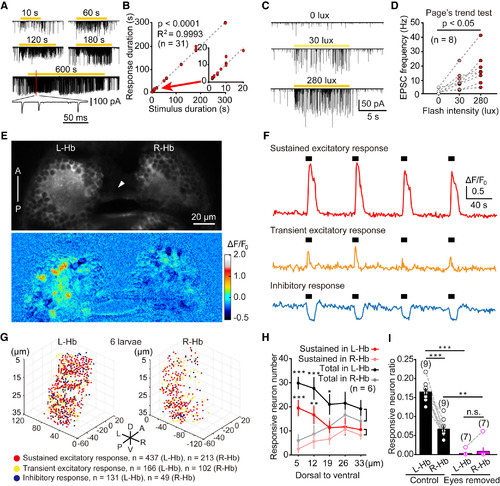
L-dHb Neurons Encode the Presence and Intensity of Ambient Light (A) Example traces showing sustained visual responses of a L-dHb neuron evoked by light flash stimuli with different durations in a 6-dpf larva. Visually evoked excitatory postsynaptic currents (EPSCs) were monitored with in vivo whole-cell recording when the cell was held at the reversal potential of Cl− (ECl−, −60 mV). Inset, individual EPSCs. (B) Plot of the light stimulus duration to the neuron response duration. Positive correlation is shown between the two variables. Part of the plot (from 0 to 20 s) was enlarged in the inset. The line represents linear regression with p < 0.0001. (C) Example traces showing sustained visual responses of a L-dHb neuron evoked by light flash stimuli with different intensities. (D) Plot of the flash intensity to the frequency of individual EPSCs in visually evoked EPSCs. Data obtained from the same neuron are connected by a dashed line. (E) In vivo confocal calcium imaging of the middle layer of the Hb (19 μm away from the dorsal epidermis) in a 6-dpf Tg(HuC:GCaMP5.0)ion13dTg larva in response to a 10 s flash. Top: raw image; bottom: heatmap of visually evoked calcium activities. Arrowhead, habenular commissure. A, anterior; P, posterior. (F) Example cases showing that three L-Hb neurons in a 6-dpf larva exhibited sustained excitatory, transient excitatory, and inhibitory calcium activities evoked by 10 s flashes (black thick lines), respectively. (G) Three-dimensional spatial distribution of neurons with three types of visual responses in both the whole L-Hb and R-Hb. 10 s flashes were used. All data from 6 larvae at 5 to ∼6 dpf were plotted in one coordinate. Red dot, neuron showing sustained excitatory responses; yellow dot, neuron showing transient excitatory responses; blue dot, neuron showing inhibitory response. The coordinate origin (0, 0, 0) corresponds to the position (middle line, anterior of Hb, dorsal of Hb). A, anterior; D, dorsal; L, left; P, posterior; R, right; V, ventral. (H) Average numbers of visually responsive neurons in each layer (from dorsal to ventral, 7 μm/layer) of the L-Hb and R-Hb. Black line, all responsive L-Hb neurons; gray line, all responsive R-Hb neurons; red line, sustained excitatory responsive L-Hb neurons; reddish line, sustained excitatory responsive R-Hb neurons. For both the all responsive neurons and sustained excitatory responsive neurons, the numbers in the first two dorsal layers of the L-Hb are significantly larger than those in the R-Hb. The data are the same with those in (G). (I) Ratio of visually responsive neurons in the L-Hb and R-Hb of control and bilateral eyes-removed larvae. Data obtained from the same larva are connected by a dashed gray line. The numbers in the parentheses represent the numbers of Hb neurons (B, D, and G) or larvae (H and I) examined. Error bars, SEM n.s., not significant; ∗p < 0.05, ∗∗p < 0.01, ∗∗∗p < 0.001 (Page’s trend test for D; unpaired two-tailed Student’s t test for H; paired two-tailed Student’s t test for comparison between the same group’s L-Hb and R-Hb in I; Mann-Whitney test for comparison between control and eyes removed in I). See also Figure S3. |

EmT Relay Visual Inputs from AF4-Projecting RGCs to L-dHb and Are Critical for Light-Preference Behavior (A) Projected confocal images of a 6-dpf Tg(Gal4s1020t,UAS:mCherry) larva showing mCherry expression in the ventral thalamus, in particular its anterior part (i.e., the eminentia thalami, EmT). The green arrow in the right panel points to mCherry-positive fibers in the Hb region. (B) Projected confocal images of a 6-dpf Tg(Gal4s1020t,UAS:mCherry,gng8:GFP) larva showing mCherry signal overlaps GFP signal in the dHb. Arrowhead, Hb commissure. (C) Sparse labeling of EmT neurons by transient GFP expression and dense labeling of RGC axons by DiD injection into one eye in Tg(Gal4s1020t,UAS:mCherry) larvae. Left: experimental diagram; right: example of projected confocal images showing neurons in the EmT region are contacted by DiD-positive RGC axons (blue) in the arborization field 4 (AF4, arrow), a retinorecipient brain region. (D) Projected confocal images (top: dorsal view; bottom: anterior view) of immunostaining of calretinin, a marker of EmT neurons, in Tg(Gal4s1020t,UAS:mCherry) (left) and Tg(Ath5:Gal4,UAS:mCherry) (right) larvae. White arrowheads, calretinin-positive cells in the EmT area. (E) Three-dimensional representation of the case shown in (C). DiD-labeled RGC axons are in blue, EGFP-expressing EmT neurons are in green, and mCherry-expressing thalamic neurons are in red. EmT neurons are contacted by RGC axons at the AF4 and send projection fibers to the Hb. White arrowhead, Hb commissure; asterisk, thalamic fibers in the optic tectum. (F) Ratio of visually responsive neurons in both the L-Hb and R-Hb of control, Tg(Gal4s1020t,UAS:BoTxBLC-GFP), and EmT lesion larvae at 6 dpf. Data from each larva were obtained from the whole five layers of the Hb. (G) Effects of synaptic blockade of the ventral thalamus (including the EmT) on light-preference behavior. WT control (in black), Tg(Gal4s1020t,UAS:mCherry) (in green), and Tg(Gal4s1020t,UAS:BoTxBLC-GFP) (in pink) larvae at 6 dpf were used. (H) Effects of bilateral EmT lesion on light-preference behavior. Two-photon laser-induced lesion was performed on 6-dpf Tg(Gal4s1020t,UAS:GFP) larvae. The numbers in the parentheses represent the numbers of larvae examined (F, G, and H). Error bars, SEM; ∗p < 0.05, ∗∗p < 0.01, ∗∗∗p < 0.001 (unpaired two-tailed Student’s t test for comparison between control and Tg(Gal4s1020t,UAS:BoTxBLC-GFP) groups in F; Mann-Whitney test for comparison between control and EmT lesion groups in F; one-way ANOVA for G; unpaired two-tailed Student’s t test for H). See also Figures S4 and S5. |

Properties of AF4-Projecting RGCs (A) Projected confocal image showing local injection of DiI into the AF4 in a 5-dpf Tg(Ath5:GFP) larva. (B) Left: projected confocal image showing retrograde labeling of AF4-projecting RGCs in contralateral retina. Right: sample images showing three morphological types of RGCs: ON, OFF, and ON-OFF, dendrites of which stratify in the inner part of the interplexiform layer (IPL), the outer part of the IPL, and both the inner and outer parts of the IPL, respectively. Dashed lines represent the IPL boundary. To clarify the morphology of the three sample cells, different ranges of images along z axis were projected. D, dorsal; N, nasal; T, temporal; V, ventral. (C) Spatial distribution and percentage of the three morphological types of AF4-projecting RGCs. Data were obtained from 15 larvae examined. (D) In vivo whole-cell recording of retrogradely labeled RGCs showing four physiological types of AF4-projecting RGCs: transient ON, sustained ON, sustained ON-transient OFF, and sustained OFF. 10 s flashes were applied. All traces were averaged from four trials. (E) Spatial distribution and percentage of the four physiological types of AF4-projecting RGCs. Data were obtained from nine larvae. (F) Staining of neurobiotin (NB) (top, left) and fluorescence in situ hybridization of opn4xa (top, right). Inset: an enlarged image showing a NB- and opn4xa-positive RGC. Bottom right: percentages of AF4-projecting RGCs with opn4xa-positive signals (left bar) and opn4xa signals co-localized with AF4-projecting RGCs (right bar). Data were obtained from six larvae. The numbers in the parentheses represent the numbers of RGCs examined (C and E). See also Figure S6. |
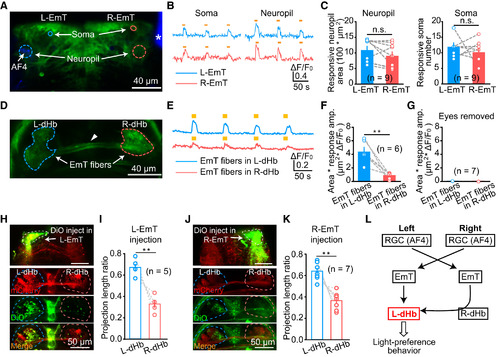
Asymmetrical Innervation from EmT to L-dHb (A) In vivo confocal imaging of the EmT in a 6-dpf Tg(Gal4s1020t,UAS:GCaMP5.0) larva. DiD was injected into the right eye (asterisk) and the left AF4 was visualized. Color circles represent somata or neuropil areas in the left EmT (L-EmT) and right EmT (R-EmT) for calculating visual responses. (B and C) Example traces (B) and summary (C) showing sustained excitatory calcium responses in both the soma and neuropil of the L-EmT (blue) and R-EmT (pink). In vivo calcium imaging was carried out from all the five layers of the EmT (10 μm per layer). 10 s flashes were applied. (E and F) Example traces (E) and summary (F) showing visual responses of EmT projection fibers in the L-dHb (blue) and R-dHb (red). 10 s flashes were used. Responses were calculated as the total responsive area multiplied by corresponding response amplitude (μm2 × ΔF/F0). (G) Visual responses of EmT projection fibers in the L-dHb (blue) and R-dHb (red) in 6-dpf Tg(Gal4s1020t,UAS:GCaMP5.0) larvae with bilateral eyes removed. (H and I) Sample images (H) and summary data (I) showing DiO-based anterograde tracing of L-EmT projections in both the L- and R-dHb. Left top in (H): EmT injection site; left bottom in (H): EmT projection fibers in the dHb. The length ratio of EmT projection fibers in either L-dHb or R-dHb to both sides of the dHb was calculated in (I). (J and K) Sample images (J) and summary data (K) showing DiO-based anterograde tracing of R-EmT projections in both the L- and R-dHb. (L) Working model showing that the AF4-projecting RGCs-EmT-L-dHb pathway mediates light-preference behavior. The number in the parentheses represents the number of larvae examined. Error bars, SEM n.s., not significant; ∗∗p < 0.01 (paired two-tailed Student’s t test). See also Figures S7 and S8. |

Confocal Images of Hb Before and After Lesion of L-Hb or R-Hb. (A and B) Example images showing lesion of the L-Hb (A) and R-Hb (B) in two 6-dpf Tg(gng8:Gal4,UAS:GFP) larvae from dorsal to ventral (layer 1 to layer 5). Blurred image of the left-bottom panel in (A) was induced by animal movement. After lesion, bulb-like structures (stars) appeared and GFP-positive neurons could not be clearly observed. (C) Percentages of ablated neurons within the 5 layers of the L-Hb (black) and R-Hb (grey). Data were obtained from 6 larvae for the L-Hb lesion and 5 larvae for the R-Hb lesion. Error bars, SEM. |

Physiological Characterization and Spatial Distribution of Visually Responsive Hb Neurons by Using In Vivo Whole-cell Recording and Confocal Calcium Imaging. (A) Example traces showing that visually responsive Hb neurons can be classified into three types, which exhibits sustained excitatory, transient excitatory, or inhibitory responses, respectively. The cells were held at -60 mV. The brown thick lines represent flash stimuli. (B) Percentages of the three types of visually responsive neurons in the L-Hb, R-Hb, and whole Hb. Data were obtained through in vivo whole-cell recording. (C) Calcium activities of neurons in all the five Hb layers (5μm, 12μm, 19μm, 26μm, and 33 μm away from the dorsal) in a 6-dpf Tg(HuC:GCaMP5.0)ion13dTg larva in response to 10-s flash stimuli. The response amplitude is color-coded. A, anterior; L, left; P, posterior; R, right. (D) Percentages of the three types of visually responsive neurons in the L-Hb, R-Hb, and whole Hb. Data were obtained through in vivo calcium imaging. (E and F) Mean numbers of all responsive (E) or sustained excitatory responsive (F) neurons in the L-Hb and R-Hb for each larva. (G and H) Mean numbers of all responsive (G) or sustained excitatory responsive (H) neurons in the L-dHb and ventral L-Hb (L-vHb) (the first two dorsal layers versus the last two ventral layers) for each larva. The data used in (D - H) are the same with those in Figures 4G and 4H. The numbers in the brackets represent the numbers of neurons (B and D) or larvae (E-H) examined. Error bars, SEM. *p < 0.05 (paired two-tailed Student’s t test). |
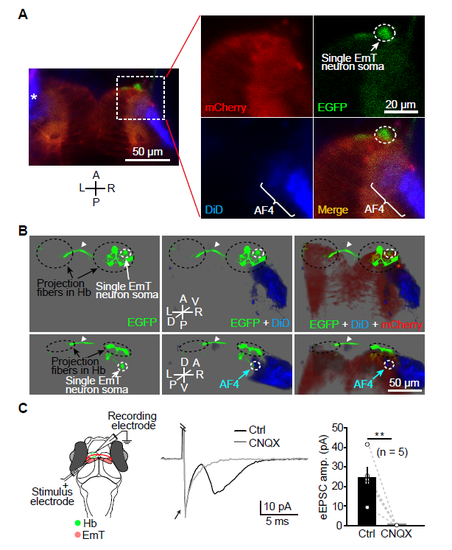
Single Cell Labeling and In Vivo Whole-cell Recording Show Contacts between RGC Axons and EmT Neurons at the AF4, and Synaptic Connections Made by EmT Projection Fibers on Hb Neurons. (A) Sparse labeling of a single neuron in the R-EmT by transiently expressing EGFP and dense labeling of RGC axons by injecting DiD into the left eye in Tg(Gal4s1020t,UAS:mCherry) larvae. Projected confocal images show that an EGFP-expressing neuron in the EmT region contacts DiD-positive RGC axons (blue) at the AF4. Asterisk, left retina. A, anterior; L, left; P, posterior; R, right. (B) Three-dimensional representation of the case shown in (A). DiD-labeled RGC axons are in blue, an EGFP-expressing EmT neuron is in green, and mCherry-expressing thalamic neurons are in red. The EmT neuron is contacted by RGC axons at the AF4 and sends projection fibers to the ipsilateral R-Hb and then to the contralateral L-Hb via the habenular commissure (arrowhead). A, anterior; D, dorsal; L, left; P, posterior; R, right; V, ventral. (C) In vivo whole-cell recording of L-dHb neurons in response to local electrical stimulation of the ipsilateral EmT. Left, recording diagram; Middle, example traces of electrically evoked EPSCs (eEPSCs) in a L-dHb neuron before and after bath application of CNQX (50 μM). The electrical artifact (arrow) was truncated for clarification. Right, summary. Data obtained from the same neuron are connected by a dashed line. Error bars, SEM. **p < 0.01 (paired two-tailed Student’s t test). |

Effect of Ventral Thalamus Silencing and EmT Lesion on Light-Preference Behavior. (A) Individual difference of BoTxBLC-GFP expression in Tg(Gal4s1020t,UAS:BoTxBLCGFP) larvae. Each whole-body image was spliced from 3 contiguous images due to limited size of the view field of the microscopy. Left, larva showing strong expression in both the EmT and spinal cord; Right, larva showing sparse expression in the spinal cord but relative strong expression in the EmT. In the present study, larvae with expression pattern similar to the right panel were used. (B) Total swimming distance within 5 min in control, Tg(Gal4s1020t,UAS:mCherry) control and Tg(Gal4s1020t,UAS:BoTxBLC-GFP) larvae. Data were the same as in Figure 5G. The numbers in the brackets represent the numbers of larvae examined. (C) Example traces of 5-min swimming in WT control, Tg(Gal4s1020t,UAS:mCherry) control and Tg(Gal41020t,UAS:BoTxBLC-GFP) larvae at 6 dpf. (D) Example images showing two-photon laser-induced lesion of the bilateral EmT in a 6-dpf Tg(Gal4s1020t,UAS:GFP) larva from dorsal to ventral (layer 1 to layer 5, 10 μm per layer). The splice-like line in the middle of images was the boundary between left and right hemispheres. After lesion, bulb-like structures (pink stars) appeared and GFP-positive neurons could not be clearly observed in the EmT. (E) Percentages of ablated neurons within the 5 layers of the EmT. Data were obtained from 6 larvae. Error bars, SEM. (F) Example traces of 5-min swimming in WT control and EmT lesion larvae at 6 dpf. Error bars, SEM. n.s., no significant. |