
- Title
-
G protein-coupled receptor 183 facilitates endothelial-to-hematopoietic transition via Notch1 inhibition
- Authors
- Zhang, P., He, Q., Chen, D., Liu, W., Wang, L., Zhang, C., Ma, D., Li, W., Liu, B., Liu, F.
- Source
- Full text @ Cell Res.
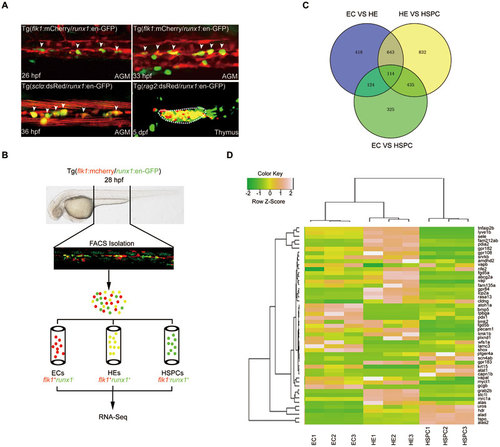
RNA-deep sequencing analysis of gene expression in ECs, HE and HSPCs from Tg(flk1:mCherry/runx1:en-GFP) transgenic embryos. (A) Fluorescence signals in AGM and thymus of the indicated transgeneic lines showing that Tg(runx1:en-GFP) is able to label HE and HSPCs. White arrowheads denote HE or emerging HSPCs in AGM. (B) Flowchart of sorting and RNA-Seq analysis of the indicated cells from 28 hpf Tg(flk1:mCherry/runx1:en-GFP) embryos. (C) RNA-Seq analysis results showing the numbers of differentially expressed genes in sorted ECs, HECs and HSPCs from 28 hpf Tg(flk1:mCherry/runx1:en-GFP) embryos. (D) Heat-map analysis of selected genes based on RNA-Seq data. |

Gpr183 plays an indispensable role during definitive hematopoiesis in zebrafish. (A) Generation of gpr183 mutant using the CRISPR/Cas9 technique. PAM sequence is 'TGG' (in blue); alignment of WT and mutated sequences is listed below. (B, C) Reduced expression of cmyb (or runx1) and rag1 in gpr183 mutant embryos (B) and clotrimazole-treated embryos (C). Red arrowheads indicate cmyb or runx1 expression in AGM, and white circles denote rag1 expression in the thymus. (D) The number of HE in Tg(gpr183−/−;flk1:mCherry/runx1:en-GFP) embryos is attenuated significantly compared with that in control embryos. White arrowheads denote HE in the AGM region. (E) Dot-plot quantification analysis of HE in sibling control and gpr183 mutant. Error bar represents SD. ****P < 0.0001. (F) Hematoxylin-eosin staining of head kidney section showing hematopoietic defect in 12-week-old gpr183 heterozygous mutant fish. PHENOTYPE:
|
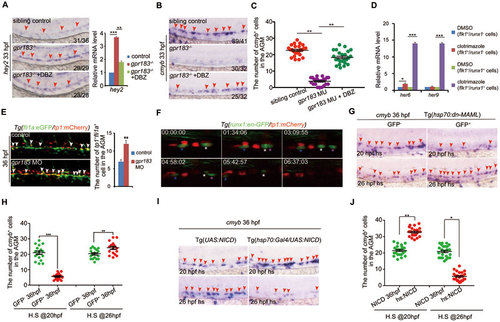
Downregulation of Notch signaling is required for definitive hematopoiesis. (A) The increase in hey2 expression in gpr183 mutant is reversed by DBZ treatment. Right panel shows the qPCR quantification. (B) The decrease in cmyb expression in gpr183 mutant is reversed by DBZ treatment. In A and B, red arrowheads indicate hey2 or cmyb expression in the AGM region at 33 hpf. (C) Dot-plot analysis of cmyb+ cell numbers in AGM. (D) Clotrimazole treatment increases expression levels of her6 and her9 in flk1+runx1+ cells at 28 hpf. (E) Notch-active endothelial cells increase in gpr183 morphant (n = 15 for control and morpholino treatment). Right panel shows the quantification analysis. (F) EHT from 37 (shown as 00:00:00) to 43 hpf in Tg(runx1:en-GFP/tp1:mCherry) embryo. Asterisks label individual cells. (G, H) cmyb expression in the AGM region of control embryos and embryos in which Notch signaling is inhibited. Tg(hsp70:dn-MAML) embryos expressing a dominant negative (dn) isoform of the murine mastermind-like (MAML) protein fused to GFP under a hsp70 promoter were heat shocked at 20 or 26 hpf; cmyb expression was examined at 36 hpf. GFP− embryo serves as a control. Representative images are shown in G and the dot-plot quantification analysis is shown in H. (I, J) cmyb expression in the AGM region of control and Notch signaling-activated embryos. Tg(UAS:NICD) (NICD, control) and Tg(hsp70:GAL4/UAS:NICD) (hs:NICD) embryos were heat shocked at 20 or 26 hpf and cmyb expression was examined at 36 hpf. Representative images are shown in I, and the dot-plot quantification analysis is shown in J. In G and I, red arrowheads mark the staining signals in AGM. Error bar represents SD. *P < 0.05, **P< 0.01, ***P < 0.001. |

Gpr183 cooperates with Arrb1 and Nedd4 to downregulate Notch signaling. (A) Internalization of Gpr183-GFP in 90% epiboly embryos (n = 6 for each treatment). White arrowheads denote the internalized Gpr183-GFP in cytoplasm. (B) Gpr183 interacts with Arrb1 in 7α-25-OHC-stimulated cells. 293T cells were transfected with Gpr183-Flag and/or Arrb1-Myc and stimulated with 7α-25-OHC for 0.5 h. Cell lysates were subjected to immunoprecipitation using anti-Myc followed by western blot analysis. (C) Expression of runx1, cmyb and hey2 in arrb1 morphants. Red arrowheads label the staining signals in AGM. (D) NICD expression in zebrafish embryos treated with 7α-25-OHC (from 1-cell stage to 36 hpf) or MG132 (from 26 to 36 hpf). Right panel shows the quantification analysis. (E) MS analysis of Notch1-interacting proteins in control or 7α-25-OHC-treated AGM cells. Mouse E10.5 AGM cells were cultured in the presence of hematopoietic cytokines for three days, and then treated with DMSO or 7α-25-OHC for 1 h. (F) Polyubiquitination of NICD-Flag (zebrafish) induced by zebrafish Nedd4a-GST (Nedd4a(Z)) or mouse Nedd4-GST (Nedd4(M)). (G) GST pull-down assay showing the interaction between Nedd4-GST and NICD-Flag. (H) runx1 expression is reduced in nedd4a morphants and increased in nedd4a-overexpressing embryos. (I) fli1a+tp1+ cells (white arrowheads) are increased in nedd4a morphants and are reduced in nedd4a-overexpressing embryos. Right panel shows the quantification result. (J) NICD expression in nedd4a morphants or nedd4a-overexpressing embryos. Right panel shows the quantification result. (K) HE in Tg(flk1:mCherry/runx1:en-GFP) embryos after nedd4a knockdown or 7α-25-OHC treatment. White arrowheads indicate HE in the AGM region at 36 hpf. Error bar represents SD. *P < 0.05, **P < 0.01, ***P < 0.001, ****P < 0.0001. |
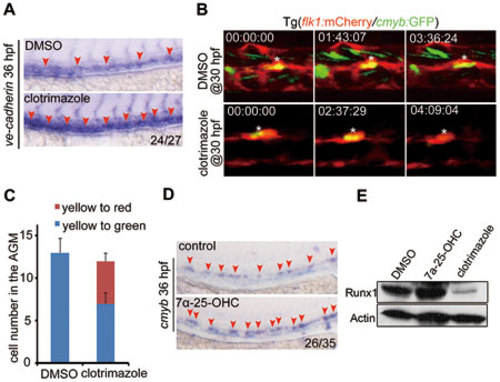
7α-25-OHC stimulation facilitates HSPC development in zebrafish. (A) Expression of ve-cadherin increases in clotrimazole-treated embryos. (B) Transition of HE to HSPCs or non-hemogenic ECs after DMSO or clotrimazole treatment beginning at 30 hpf. White asterisk indicates the same cell in different frames. (C) Quantification of HE (flk1+cmyb+, yellow cells in B) differentiating to HSPCs (flk1−cmyb+, green cells in B) or non-hemogenic ECs (flk1+cmyb−, red cells in B) (n = 5). Error bar represents SD. (D, E) runx1 expression in embryos treated with 7α-25-OHC or clotrimazole and examined at 36 hpf by WISH (D) and western blotting (E). Red arrowheads in A and D label the staining signals in AGM. |

Tg(runx1:en-GFP) can recapitulate runx1 endogenous expression in vivo. (A)Scheme of generation of the stable transgenic fish line. (B) GFP signals in Tg(runx1:en-GFP) embryos decreased after injecting runx1 MO. Red arrowheads denote the GFP+ cells, and red dashed cycles mark the thymus region. (C) Heatmap analysis of the known genes involved in hematopoietic or vascular development. |

Expression profile and loss-of-function assay identify genes essential for definitive hematopoiesis.(A)Expression pattern of the 17genes at 36 hpf by whole-mount in situ hybridization (WISH). Red arrowheads denote the staining signals in the AGM region. (B, C) Decreased runx1/cmyb expression in 7 different morphants at 36 hpf,and the dot-blot quantification analysis. Red arrowheads mark runx1/cmyb expression in the AGM region. Error bar, ±s. d. *p<0.05, **p<0.01. |

gpr183 is expressed in the hemogenic endothelium (HE) after 24 hpf, and is essential for adult hematopoiesis in zebrafish.(A) Time-course expression of gpr183 ranging from one-cell stage to 36 hpf shows that gpr183 is not expressed before 24 hpf. (B) Frozen sections of the embryos after WISH show that gpr183 is expressed in the AGM at about 26 hpf. (C) gpr183 expression in sorted ECs, HEs and HSPCs at 28 hpf by qPCR. Error bar, ±s. d. *p<0.05, ***p<0.001. (D) gpr183 expression using double fluorescence in situ hybridization (dFISH) in 30hpf Tg(fli1a:eGFP) embryo. (E) gpr183 is not expressed in gpr183-/- embryos. |
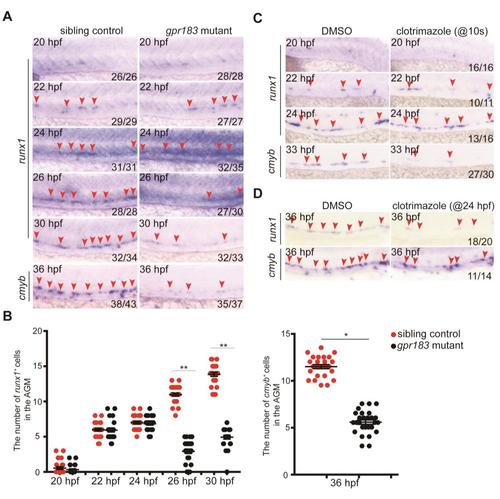
Gpr183 influences HE development after 24 hpf. (A, B) Time-course expression of runx1/cmyb in gpr183 mutants and the dot-blot quantification analysis. Error bar, ±s. d. *p<0.05, **p<0.01. (C) Time-course expression of runx1/cmyb in embryos treated with clotrimazole (from 10 somites). (D) runx1/cmyb expression in embryos treated with clotrimazole (from 24 hpf). Red arrowheads denote runx1/cmyb expression in the AGM region. |
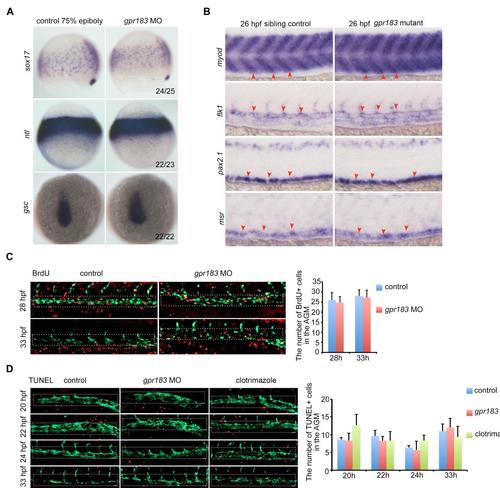
Gpr183 regulates HE/HSC development specifically.(A) The expression of mesoderm markers sox17, ntl and ectoderm marker gsc do not altered in gpr183 morphants at 75% epiboly. (B) The expression of niche cells markers, including somite marker myod, endothelial cell marker flk1, pronephric duct marker pax2.1 and venous marker msr, do not altered in gpr183 mutants. (C) BrdU assay in Tg(fli1a:eGFP) embryos after knocking down gpr183 (n=8 for each). (D) Time-course TUNEL assay in Tg(fli1a:eGFP) embryos after blocking gpr183 signaling (n=6 for each). White rectangles mark the proliferative or apoptotic cells in the AGM. |
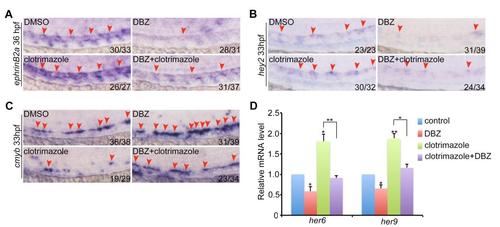
Notch signaling functions downstream of Gpr183. (A-C) The expression of ephrinB2a, hey2 and cmyb at 36 hpf in embryos treated with clotrimazole and/or DBZ. (D) her6 and her9 expression at 36 hpf in embryos treated with clotrimazole and/or DBZ by qPCR. Error bar, ±s. d. *p<0.05, **p<0.01. |