
- Title
-
An Evolutionarily Conserved Role for Polydom/Svep1 During Lymphatic Vessel Formation
- Authors
- Kärpanen, T., Padberg, Y., van de Pavert, S.A., Dierkes, C., Morooka, N., Peterson-Maduro, J., van de Hoek, G., Adrian, M., Mochizuki, N., Sekiguchi, K., Kiefer, F., Schulte, D., Schulte-Merker, S.
- Source
- Full text @ Circ. Res.
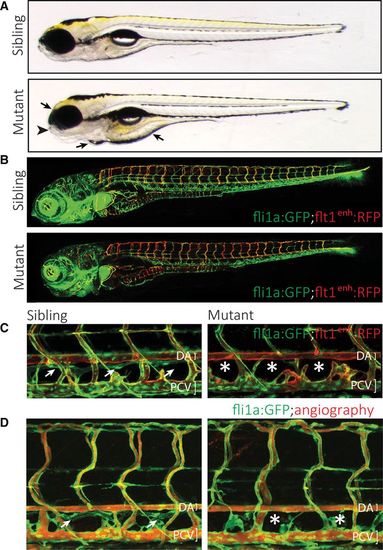
Characterization of a zebrafish mutant that affects the formation of the lymphatic vascular system. A, Gross morphology of the Ly02-512 mutant. The mutant embryos appear without major macroscopic defects or developmental delay, and form a swim bladder at 5 d post-fertilization (dpf). However, closer examination shows abnormalities in the jaw (arrowhead), and the embryo displays edema around the heart, eye, and intestine (arrows). B, Analysis of the vasculature in a fli1a:GFP; flt1enh:RFP transgenic background, highlighting arteries (red). Note the normal overall patterning of the blood vasculature despite the higher proportion of intersegmental arteries in the mutant embryo. C, Mutant embryos lack all or most aspects of the thoracic duct (TD), which in wild-type siblings is positioned just ventral to the dorsal aorta (DA; white arrows in C and D) but is absent in mutants (asterisks). D, Rhodamine dextran injection into the cardinal vein shows normal blood circulation in Ly02-512 mutants. |

Ly02-512 encodes an allele of polydom/svep1. A, Positional cloning approach to identify the molecular lesion in Ly02-512 mutant embryos. Using polymorphic markers, Ly02-512 was mapped to a region between markers z4.29 and z.7.4 comprising ≈350 kb on linkage group 7. B, Three different BAC constructs that were independently inserted as transgenes into the Ly02-512 line containing 12 candidate genes within the linkage group. C, In Ly02-512 mutant embryos which contained the DKEY-8E16 BAC, the TD phenotype was rescued (P<0.001), suggesting DKEY-8E16 to contain the gene of interest. D, Two other mutant lines identified in the forward genetic screen, Ly04-093 and Ly05-265, failed to complement Ly02-512 and each other, suggesting that they represent alleles of the same gene. E, Sequencing of the 3 independent mutant alleles revealed 3 different nonsense substitutions, predicted to result in truncated versions of the Polydom/Svep1 protein. F, Schematic presentation of the Polydom/Svep1 protein domain structure and the positions of the truncations in the 3 mutant lines. Red rectangle: signal peptide; blue pentagon: von Willebrand factor type A domain; yellow ovals: SUSHI repeat; green pentagons: epidermal growth factor (EGF)–like and calcium-binding EGF-like domains; and pink hexagon: pentraxin domain. |

Polydom/svep1 mutants show reduced venous and lymphovenous sprouting. A and F, Quantification of sprouts from the posterior cardinal vein (PCV) in wild-type (wt) siblings and polydom/svep1 mutants, in plcg1 morphant embryos. Knockdown of plcg1 suppresses arterial formation, hence only venous structures can be observed in a fli1a:GFP transgenic background. Heterozygous embryos show a significant reduction in venous sprouting events from the PCV, and this is further exacerbated in mutant embryos at 54 h post-fertilization (hpf; wt siblings: n=29, heterozygous embryos: n=53, and polydom/svep1 mutants: n=26). B, Still frames from confocal time-lapse imaging of a wt sibling and polydom/svep1 mutant embryo in a fli1a:GFP; flt1enh:RFP double transgenic background are shown over the course of 32.5 to 46.5 hpf. Both the number of secondary sprouts from the PCV (yellow arrowheads) and parachordal lymphangioblast (PL) cells (white arrowheads) were reduced in mutant embryos. C and G, polydom/svep1 mutant embryos form a reduced number of PLs at the horizontal myoseptum (HMS) region. Confocal images of wt sibling and polydom/svep1 mutant embryos at 48 hpf in fli1a:GFP;flt1enh:RFP background and quantification of PLs at 54 hpf (wt siblings: n=8, heterozygous embryos; and n=11, polydom/svep1 mutants: n=6). D, PL cells at the level of the HMS fail to migrate along intersegmental arteries in the polydom/svep1 mutants. Still frames from confocal time-lapse imaging of a wt sibling (a–c) and a polydom/svep1 mutant embryo (d–f) in a fli1a:GFP transgenic background are shown over the course of 2.5 to 3.5 d post-fertilization (dpf). E and H, An increased number of arterial intersegmental vessels (ISVs) at the expense of venous ISVs in polydom/svep1 mutants is highlighted by flt1enh:RFP expression in fli1a:GFP background at 5 dpf (siblings: n=20, polydom/svep1 mutants: n=10). Values are presented as means±SD. **P<0.01; ***P<0.001. |
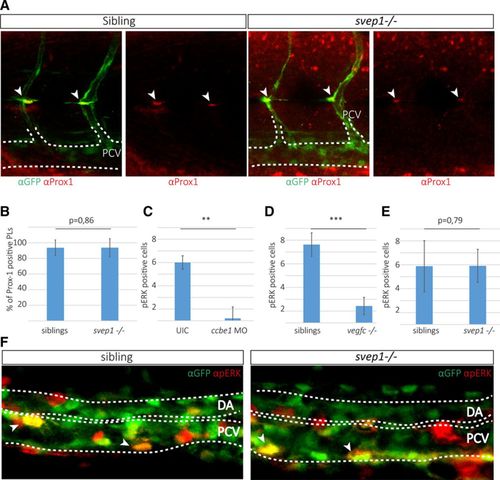
Posterior cardinal vein (PCV) cells express pERK and parachordal lymphangioblast (PL) cells express Prox-1 in svep1 mutant embryos. A, Partial maximal projection of antibody staining against Prox-1 (red) and fli1a:GFP (green) in embryos from an svep1+/−; fli1a:GFP incross at 48 h post-fertilization (hpf). Prox-1–positive PL cells are indicated by an arrowhead. B, Quantification of Prox-1–positive PL cells across 9 somites at the horizontal myoseptum (HMS) in siblings (96 out of 106 counted PLs are Prox-1 positive in 18 embryos) and svep1 mutants (28 out of 30 PLs are Prox-1 positive in 8 mutant embryos). C–E, pERK-positive cells were quantified in the PCV by scoring RFP and GFP coexpression (indicated by arrows) laterally across 6 somites in the trunk. C, In ccbe1 morpholino (MO) injected embryos (total number of 6 pERK-positive cells in 5 ccbe1 morphants; total number of 36 pERK-positive cells in 6 uninjected controls) and (D) vegf-chu6410 mutants (total number of 17 pERK-positive cells in 7 mutants and 67 pERK-positive cells in 8 siblings), the amount of pERK-positive cells is significantly reduced, whereas in svep1 mutants (E and F) no difference in pERK can be detected in the PCV (total number of 151 pERK-positive cells in 31 siblings compared with 48 pERK-positive cells in 9 svep1 mutants). F, Partial maximal projections of antibody staining against pERK (red) and fli1a:EGFP (green) in svep1+/−; fli1a:GFP incrosses show no difference in the amount of pERK-positive cells in the PCV at 32 hpf. Bar graphs show mean±SD. For statistical analysis, the Mann–Whitney test was applied in all panels. |
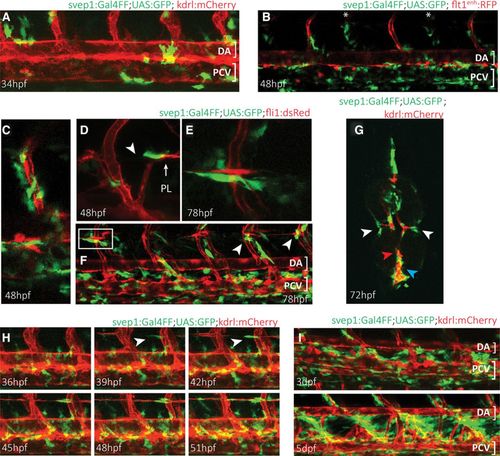
Zebrafish polydom/svep1 is expressed dynamically at regions of venous and lymphatic endothelial cell migratory activity. A, The first polydom/svep1 expression appears around 34 h post-fertilization (hpf) in nonendothelial cells along the dorsal aorta (DA) and posterior cardinal vein (PCV), as depicted by svep1:Gal4FF;UAS:GFP expression in a kdrl:mCherry transgenic background. B, By 48 hpf, the number of polydom/svep1-positive cells along the PCV has increased, and polydom/svep1-positive cells can abundantly be found in the immediate vicinity of both arterial (highlighted in red in flt1enh:RFP background) and venous (marked with asterisks) intersegmental vessels (ISVs). C, Higher magnification of an independent region at 48 hpf, demonstrating the tight connection between endothelial cells (red) and polydom/svep1-positive cells (green). D–F, Between 48 and 72 hpf, when parachordal lymphangioblast (PL) cells populate the horizontal myoseptum (HMS) region and start to migrate dorsally and ventrally along arterial ISVs, individual cells in the midline of the embryo start to express polydom/svep1. The polydom/svep1-expressing cells are in a immediate contact with migrating PL cells. G, Cross-section of a 72 hpf svep1:Gal4FF;UAS:GFP embryo in a kdrl:mCherry background. Note the close association of PL cells (red) and polydom/svep1-positive cells (green) in the HMS region (white arrow heads), and of PCV cells and polydom/svep1-positive cells (blue arrow head). The dorsal aorta (red arrow head) is not covered by polydom/svep1-positive cells at this time point any more. H, Still frames of a confocal time-lapse imaging of a svep1:Gal4FF;UAS:GFP;kdrl:mCherry embryo from 36 to 51 hpf. Polydom/svep1-positive cells (green) and PL cells (red) start appearing at the horizontal midline region around 39 hpf. Note the almost simultaneous appearance of both cell types. The full movie can be seen online. I, At 3 and 5 d post-fertilization (dpf), polydom/svep1 expression can be seen in between the DA and the PCV, exactly in the region, which the lymphatic cells of the future thoracic duct (TD) will populate. |
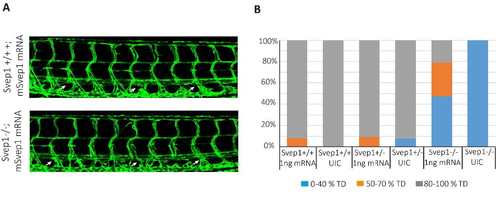
Rescue of svep1 mutants with murine Svep1 mRNA: A: Lateral view of polydom/svep1 sibling (top) and mutant (bottom) embryos at 5dpf. Embryos had been injected at the 1-2 cell stage with 1ng of murine Svep1 mRNA generated by in vitro transcription. At 5dpf the extent of the TD (arrows) across ten body segments was scored (arrows), and embryos were subsequently genotyped. Note the complete thoracic duct structure in the mutant embryo. B: Quantification of a separate experiment, where control embryos were left un-injected, while experimental embryos were injected with 1ng of murine Svep1 mRNA. Embryos were scored as described above, and subsequently genotyped. All un-injected mutant embryos developed thoracic duct fragments in maximally 40% of their trunk segments, while in injected embryos 30% showed a thoracic duct in 50-70% of their trunk segments, and 20% of injected mutant embryos even showed complete rescue. |
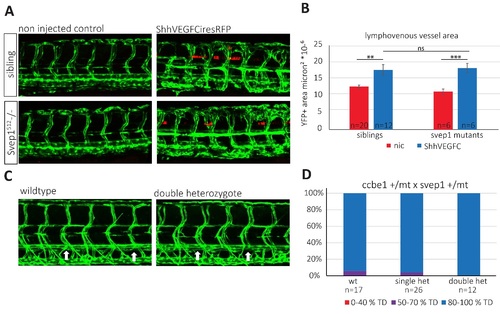
VEGFC over-expression and Svep1 and Ccbe1 interaction: (A – B) svep1 mutant endothelial cells respond to VEGFC. (A) Confocal projections of siblings and Svep1 mutants expressing VEGFC IRES RFP in the floorplate versus non injected control at 2 dpf, transgene: fli1a:GFP . Forced expression of human VEGFC in the floorplate led to excessive vessel sprouting both in siblings and in svep1 mutants (B) Quantification of endothelial vessel area as measured by GFP+ area surrounding a position of comparable RFP expression. Data sets were tested for normality (Shapiro-Wilk) and equal variance. P-values were determined by Student's t-test. Values are presented as means ± standard error of mean values (SEM). ns = not significant; * = P<0.05; ** = P<0.01; *** = P<0.001. (C - D) svep1 and ccbe1 do not genetically interact (C) Confocal projections of wt and svep1/ccbe1 double heterozygous animals do not show any defect in TD generation as compared to wildtype controls at 5 dpf, transgene: fli1a:GFP. Arrows indicate the position of the TD (D). Quantification of the extent of TD formation across ten body segments in the trunks of wildtype, single heterozygote and double heterozygote embryos do not indicate genetic interaction between svep1 and ccbe1. One out of 3 independent experiments is shown. |
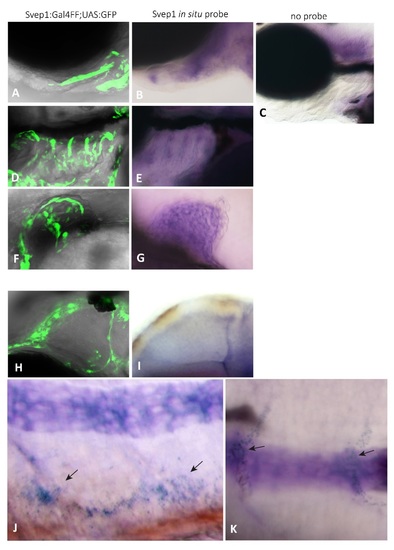
Comparison of svep1 expression domains in the svep1:GalFF; UAS:GFP transgenic line with whole mount in situ hybridization of non-transgenic embryos. Polydom/svep1 expression at 48hpf (F,G,H,I,J) and 72hpf (A,B,C,D,E) of TL fish. A,B: Higher magnification of the ceratohyal underneath the eye of a transgenic embryo (A) and upon in situ hybridization at 72hpf ; C: negative control embryo at 72hpf, lacking RNA antisense probe; D,E: svep1 is expressed in the branchial arch region at 72hpf , which can be seen in both the transgene (D) and by in situ hybridization (E); (C) serves as a negative control for (D,E) as well. F,G: svep1 expression in the fin bud at 48hpf ; H,I: svep1 expression abutting the middle cerebral vessel at 48hpf; J: Lateral view of polydom/svep1 expression in the region of the PCV at 48hpf; K: svep1 expression (indicated by the arrows) covering ISVs (compare to the transgenic expression in Figure 5B, C , main text). Notochord staining in (J,K) represents background staining and was also observed in all negative controls. Lateral views in all panels, anterior to the right. EXPRESSION / LABELING:
|

Genetic interaction of Svep1 and Itgα9: A-C: Lateral view of representative examples of fli1a:GFP transgenic embryos that are either wildtype for both svep1 and integrin α9 (A), mutant for integrin α9 (B), or mutant for integrin α9 and heterozygous for svep1 (C). Neither of the genetic combinations shows a thoracic duct (arrows) phenotype. Hence, we have found no evidence for a genetic interaction of integrin α9 and svep1. D: Quantification of the embryos presented in (A-C). PHENOTYPE:
|
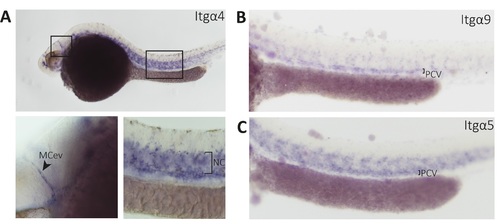
Whole mount in situ hybridization of integrin α9, α4 and α5 show vessel-specific expression: The expression of itgα4 (A) itgα9 (B) and itgα5 (C) at 32 hpf as detected by in situ hybridization (lateral views). A: itgα4 is expressed in the mid cerebral vessel (MCev) and in the notochord; B,C: itg α9 and itgα5 is expressed in the PCV and the intersegmental vessels. EXPRESSION / LABELING:
|

Unillustrated author statements PHENOTYPE:
|