
- Title
-
Intestinal epithelial cell Caveolin 1 regulates fatty acid and lipoprotein cholesterol plasma levels
- Authors
- Otis, J.P., Shen, M.C., Quinlivan, V., Anderson, J.L., Farber, S.A.
- Source
- Full text @ Dis. Model. Mech.

Cav1 and caveolae localize to the basolateral and lateral PM of enterocytes. (A) Live imaging of Tg(hsp70l:cav1-eGFP) (6 dpf) zebrafish larvae shows localization of Cav1-eGFP to the lateral and basolateral plasma membranes (PM) of enterocytes, but not the luminal brush border. One enterocyte is outlined. (B) Mean fluorescence intensity, in relative units, of Cav1-eGFP in subcellular regions of larval enterocytes. Data is mean±s.e.m, n=3: nine fish per replicate, three areas of each region per fish; groups with different letters are significantly different (one-way ANOVA, P<0.05). (C,D) Representative EM images of caveola vesicles observed on the basolateral and lateral PMs of larval (6 dpf) (C) and adult (D) zebrafish enterocytes. BB, brush border; L, lateral membrane; B, basolateral membrane; I, intracellular; c, caveolae. Scale bars: 100 nm. EXPRESSION / LABELING:
|
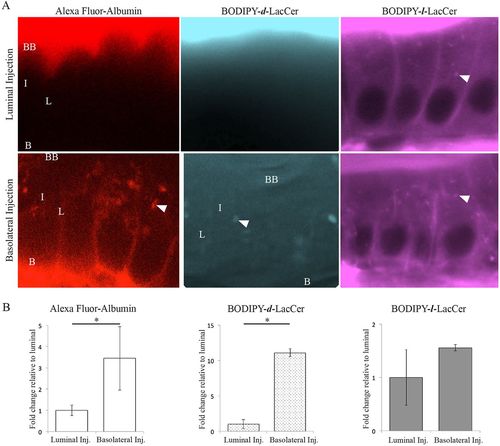
Fluorescently labeled endocytic cargos enable imaging of caveolar endocytosis in the intact zebrafish intestine. (A) Representative images show that the caveolar-specific cargos Alexa Fluor–albumin and BODIPY–d-LacCer are internalized from the basolateral PM of enterocytes, but not the intestinal lumen. In contrast, the cargo transported specifically by clathrin-coated vesicles, BODIPY–l-LacCer, is transported into enterocytes from both the basolateral and luminal PMs. BB, brush border; L, lateral membrane; B, basolateral membrane; I, intracellular; N, nucleus; arrowhead, intracellular puncta. (B) The mean fluorescence intensity of Alexa Fluor–albumin and BODIPY–d-LacCer on the lateral PM of enterocytes is significantly greater following basolateral injection compared to luminal injection. In contrast, the mean fluorescence intensity of BODIPY–l-LacCer on the lateral PM of enterocytes is the same following basolateral and luminal injection. Data is presented relative to lateral PM mean fluorescence intensity following luminal injection. Mean±s.e.m, n=3: nine fish per replicate, three areas of each region per fish; Student's t-test; *P<0.05. |