
- Title
-
Conservation of the Nrf2-Mediated Gene Regulation of Proteasome Subunits and Glucose Metabolism in Zebrafish
- Authors
- Nguyen, V.T., Fuse, Y., Tamaoki, J., Akiyama, S.I., Muratani, M., Tamaru, Y., Kobayashi, M.
- Source
- Full text @ Oxid Med Cell Longev

ZFIN is incorporating published figure images and captions as part of an ongoing project. Figures from some publications have not yet been curated, or are not available for display because of copyright restrictions. |
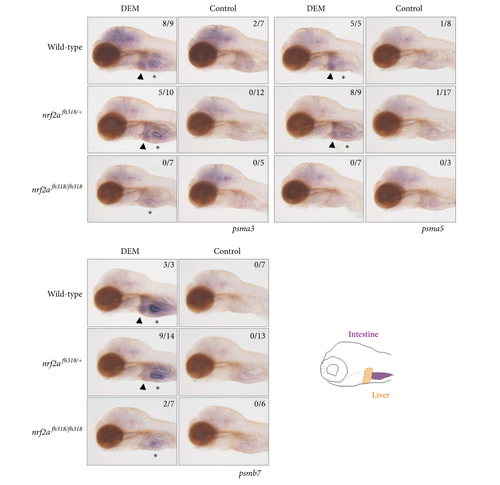
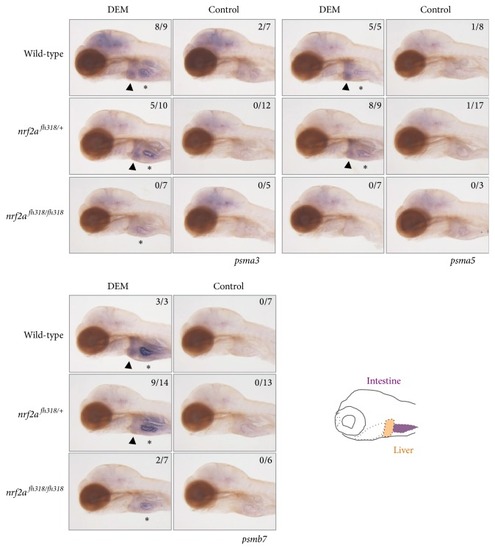
The induction profiles of proteasome subunit genes. Whole-mount in situ hybridization was performed to analyze the induction profiles of psma3, psma5, and psmb7 using 4 dpf nrf2afh318 mutant larvae treated with or without 100 μM DEM for 12 h. The arrowheads indicate positive expression in the liver, and asterisks denote the basal expression in the intestine. The numbers in each picture indicate the positive/tested larvae. |
|
ZFIN is incorporating published figure images and captions as part of an ongoing project. Figures from some publications have not yet been curated, or are not available for display because of copyright restrictions. |
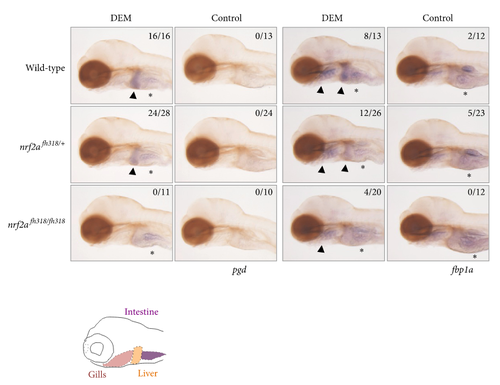
The induction profiles of glucose metabolism-related genes. Whole-mount in situ hybridization was performed to analyze the induction profile of pgd and fbp1a using 4 pdf nrf2afh318 mutant larvae treated with or without 100 μM DEM for 6 h. The arrowheads indicate positive expression in the liver and gills, and asterisks denote the basal expression in the intestine. The numbers in each picture indicate the positive expression in the liver/tested larvae. |
|
ZFIN is incorporating published figure images and captions as part of an ongoing project. Figures from some publications have not yet been curated, or are not available for display because of copyright restrictions. |
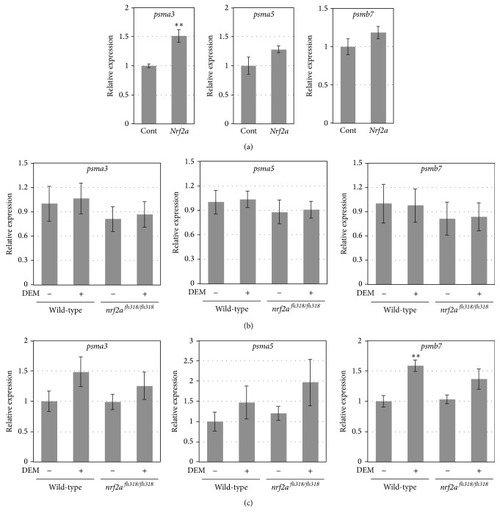
The expression of the proteasome subunit genes. (a) The gene expression of the indicated proteasome subunits in 8 h postfertilization (hpf) wild-type embryos injected with or without 100 pg of |
The induction profiles of proteasome subunit genes. Whole-mount in situ hybridization was performed to analyze the induction profiles of |
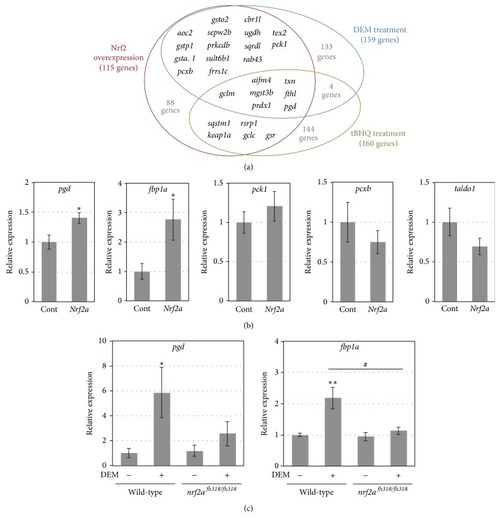
The expression of glucose metabolism-related genes. (a) The upregulated gene lineups from the three microarray experiments were compared. The data of DEM- or tBHQ-treated zebrafish larvae are from Nakajima et al. [ |
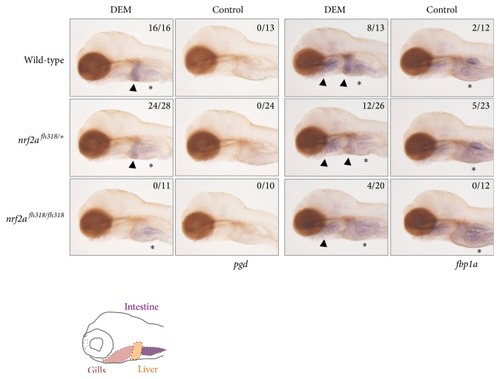
The induction profiles of glucose metabolism-related genes. Whole-mount in situ hybridization was performed to analyze the induction profile of |
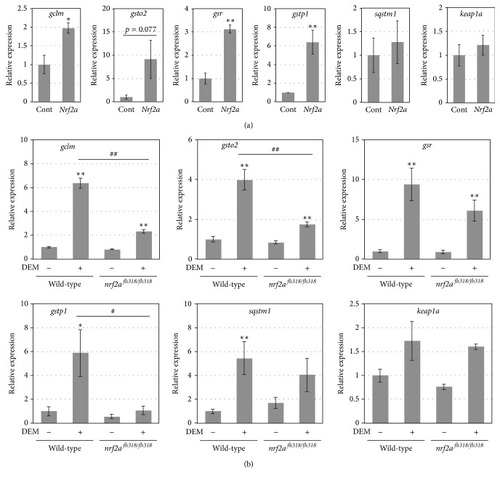
The expression of other candidate genes for zebrafish Nrf2 targets. (a) The expression of the indicated genes in 8 hpf wild-type embryos injected with or without 100 pg of |