
- Title
-
Tmem2 Regulates Embryonic Vegf Signaling by Controlling Hyaluronic Acid Turnover
- Authors
- De Angelis, J.E., Lagendijk, A.K., Chen, H., Tromp, A., Bower, N.I., Tunny, K.A., Brooks, A.J., Bakkers, J., Francois, M., Yap, A.S., Simons, C., Wicking, C., Hogan, B.M., Smith, K.A.
- Source
- Full text @ Dev. Cell
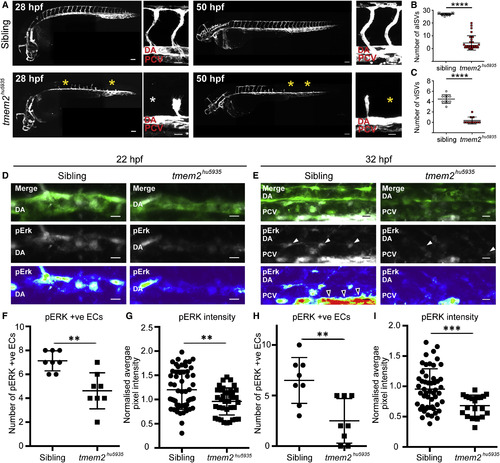
Tmem2 Is Required for Angiogenesis and Vegf Signaling (A) Lateral composite views of sibling and tmem2hu5935 mutant embryos crossed with the Tg(kdrl:mCherry) line (white) show a failure to complete angiogenesis at both arterial (28 hpf) and venous (50 hpf) sprouting stages. Yellow and white asterisks indicate the absence of sprouts in the mutants. Scale bar, 100 μm for whole embryo and 25 μm for zoom. (B) Column scatterplots depicting the number of segments with T-branching arterial ISVs per embryo at 28 hpf (n = 17 siblings, n = 29 mutants). (C) Scatterplots depicting the number of segments with venous ISVs per embryo at 50 hpf (n = 10 siblings and n = 11 mutants). (D and E) Maximum projection for whole-mount pErk immunofluorescence staining (white and heatmap) in sibling and tmem2hu5935 mutants on the Tg(kdrl:EGFP) background (green) at (D) 22 hpf and (E) 32 hpf. Average projections of fluorescence intensity for pErk are represented by heatmaps, where blue=low and red=high. Scale bar, 10 μm. pErk-positive cells indicated with white arrowheads; open arrowheads depict staining in corpuscle of Stannius. (F and G) Quantification of pErk-positive endothelial cells across four somites showed (F) significantly fewer pErk-positive endothelial cells in tmem2hu5935 mutant embryos compared with siblings at 22 hpf during primary sprouting (n = 8 sibling, n = 8 mutants) and (G) significantly lower fluorescence intensity (normalized to neuronal expression) of pERK-positive endothelial cells in mutants (n = 37) compared with siblings (n = 57) at 22 hpf. (H and I) Similarly, (H) there were significantly fewer pERK-positive endothelial cells in the PCV across eight somites of mutants (n = 8) at 32 hpf compared with siblings (n = 8; p < 0.01) and (I) significantly lower fluorescence intensity of pERK-positive cells in mutants (n = 20) compared with siblings (n = 52) at 32 hpf. DA, dorsal aorta; PCV, posterior cardinal vein. ∗∗p < 0.01, ∗∗∗p < 0.001, ∗∗∗∗p < 0.0001. Error bars represent ±SD. EXPRESSION / LABELING:
PHENOTYPE:
|

Tmem2 Expression Is Enriched in the Vasculature, the C Terminus Is Extracellular, and a Secreted C-Terminal Fragment Can Rescue the Angiogenesis Defect (A) ISH of the zebrafish trunk showing tmem2 expression is ubiquitous at 24 hpf and becomes enriched in venous endothelium at 32 hpf. (A′) tmem2 expression is also observed in angiogenic sprouts (black arrows). (B) Lateral trunk views of Tg(tmem2BAC:tmem2-mCherry) embryos showing comparable expression with tmem2 RNA. Right-side panels showing overlay with Tg(fli1a:EGFP). Tmem2-mCherry protein was observed in angiogenic sprouts (white asterisks; white arrowheads depict iridophore autofluorescence). (C) Single z scans of two venous sprouts showing Tmem2-mCherry enrichment. Closer analysis (right panels) indicate mCherry tag is extracellular (white arrowheads). Scale bar, 10 μm and 5 μm for zoom. (D) Western blot analysis for mCherry showing bands consistent with full-length Tmem2-mCherry protein (red asterisk) as well as variable-sized fragments that form over developmental time. Staged Tg(kdrl:mCherry) lysates are controls. (E) Column scatter graph representing the number of ISVs at 48 hpf per embryo in uninjected siblings (n = 13) and tmem2hu5935 mutants (n = 89) as well as tmem2hu5935 mutants injected with full-length tmem2 mRNA (yellow squares; n = 49), c-tmem2 mRNA (gray triangles; n = 51), and sc-tmem2 mRNA (red diamonds; n = 66). (F) Schematic of Tmem2 protein and blow-up of the region where three newly identified tmem2 mutant alleles derived from forward genetic screens are located (tmem2hu4800, tmem2uq1ks, and tmem2uq2ks) as well as mutations generated for analysis in (G). (G) Scatterplots representing the number of ISVs at 48 hpf per embryo in uninjected siblings (n = 25), tmem2hu5935 mutants (n = 68), and tmem2hu5935 mutants injected with full-length tmem2 mRNA (yellow squares; n = 38) or mRNA of the PbH1 domain mutants tmem2W429A (gray triangles; n = 43), tmem2R439A (red triangles; n = 17), and tmem2F608A (blue diamond; n = 14), where none of the PbH1 mutants showed capability to rescue. ∗∗∗∗p < 0.0001; ns, not significant. Error bars represent ±SD. |

Hyaluronic Acid Is Increased in Tmem2 Mutants (A) Schematic representing the strategy for the HA biosensor. mRNA encoding the HA-binding domain of mouse Neurocan fused to GFP (ssNcan-GFP) was injected into 1- to 2-cell stage embryos, grown, and imaged at the relevant time points. (B) Lateral views and zoom-in of 30 hpf Tg(kdrl:mCherry) embryos injected with ssNcan-GFP. White arrowheads indicate expression surrounding the axial vessels in the trunk and black arrowhead expression in the heart. Scale bar, 100 μm for whole embryo and 25 μm for the zoom. (C) ssNcan-GFP is increased and expanded in tmem2hu5935 mutants compared with siblings around the major axial vessels during sprouting angiogenesis. Maximum intensity projections. Scale bar, 15 μm. (D) Quantification showing significantly higher fluorescence intensity of ssNcan-GFP in mutant (n = 15) compared with sibling (n = 15) embryos. (E) Cross-sections of embryos histochemically stained for HA, counterstained for neural red, show increased HA accumulation around the major vessels of 48 hpf tmem2hu5935 mutant. (F) Maximum intensity projections of immunofluorescence staining for fibronectin in sibling and tmem2hu5935 mutants, where blue=low and red=high. Scale bar, 15 μm. (G) Quantification of fibronectin fluorescence intensity showing no significant difference between mutant (n = 8) and sibling (n = 7) embryos. DA, dorsal aorta; PCV, posterior cardinal vein; NC, notochord. ∗∗∗∗p < 0.0001. Error bars represent ±SEM. |
Depolymerized HA Rescues the tmem2 Mutant Phenotype (A) Experimental design for hyaluronidase (HA'se) or o-HA injection. (B) Lateral views of entire trunks of sibling and tmem2hu5935 mutant embryos post-injection and imaged at 38–42 hpf. Yellow asterisks indicate the absence of sprouts in uninjected mutants. Representative images demonstrate phenotypic rescue of tmem2hu5935 mutants following injection with HA'se or o-HA. Scale bar, 150 μm. (C) Scatterplots summarizing unaffected siblings in the uninjected (n = 23), HA'se injected (n = 23), o-HA injected (n = 13) or hyaluronidase heat-inactivated (HA'se inact) (n = 26) embryos. (D) Uninjected tmem2hu5935 mutants (n = 19) have significantly fewer ISVs that uninjected siblings. Mutants injected with HA'se (n = 17) or o-HA (n = 14) have significantly rescued phenotypes compared with uninjected mutants. Heat-inactivated HA'se injected mutants were not significantly different from uninjected mutants. ∗∗∗∗p < 0.0001; ns, not significant. Error bars represent ±SEM. |

Rescue of the tmem2hu5935 Mutant Phenotype by Degrading HA Requires the Vegf Pathway (A) Whole-mount pErk immunofluorescence staining (white) in sibling and tmem2hu5935 mutants on the Tg(kdrl:EGFP) background (green) at 22 hpf, injected just 3 hr prior with dextran. Scale bar, 10 μm. (B) Graph depicting the significant reduction in fluorescence intensity of pErk-positive endothelial cells in mutants (n = 43) versus sibling embryos (n = 56) following dextran injection. (C) Whole-mount pErk immunofluorescence staining in sibling and mutant embryos 3 hr after HA'se injection. Scale bar, 10 μm. (D) Scatterplots showing no significant difference in fluorescence intensity of pErk-positive endothelial cells in mutants (n = 90) versus sibling embryos following HA'se injection (n = 89). (E) Untreated vegfaa morphants (n = 8) had fewer ISVs compared with uninjected controls (n = 10) and this reduction in sprouting was not significantly different following HA'se (n = 8), o-HA (n = 11) or HA'se inact treatment (n = 9). (F) Likewise, untreated kdr/kdrl double morphants (n = 25) had no detectable ISVs compared with normal uninjected controls (n = 11), and this loss of sprouting was not significantly different following HA'se (n = 17), o-HA (n = 20) or HA'se inact treatment (n = 20). (G) Design of rescue experiments for low and high dose SU5416 treatments shown in (H) and (I). (H) Scatterplot for DMSO-treated embryos injected with HA'se (n = 27), o-HA (n = 29), or HA'se inact (n = 23) showing no difference from uninjected (n = 8) embryos. Low-dose (0.8 μM) SU5416 mildly but significantly impaired ISV sprouting in uninjected embryos (n = 21). SU5416-treated embryos injected with HA'se (n = 40) or HA'se inact (n = 46) were not significantly different from uninjected but o-HA injected embryos (n = 53) were significantly rescued (p < 0.0001). (I) At a higher dose (1 μM SU5416), DMSO treatment again had no effect on embryos not injected (n = 8), injected with HA'se (n = 12), o-HA (n = 16), or HA'se inact (n = 11). At the higher dose, all treatments (uninjected [n = 13], HA'se [n = 12], o-HA [n = 18] and HA'se inact [n = 11]) were significantly different from DMSO with no rescue in any of these conditions observed. For all scatterplots uninjected (white circles), HA'se injected (yellow squares), o-HA injected (gray triangles), HA'se inact (red diamonds). ∗∗p < 0.01, ∗∗∗∗p < 0.0001. Error bars represent ±SD. EXPRESSION / LABELING:
PHENOTYPE:
|

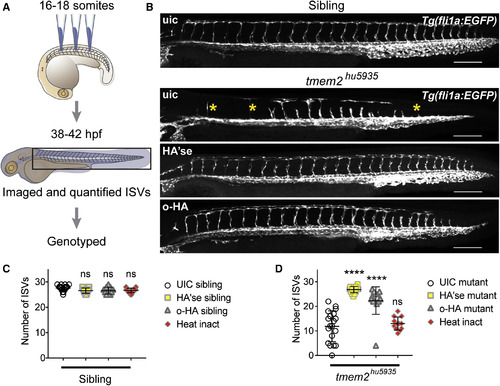
ISV Sprouting Can Be Restored by Derepressing Vegf Signaling or Treating with HA'se/o-HA (A) Experimental design to examine the effect of repressing and derepressing Vegf signaling on ISV sprouting using the inhibitor, SU5416. (B) Lateral view images of Tg(kdrl:mCherry) embryos treated according to scheme in (A). Scale bar, 25 μm. (C) Scatterplots showing SU5416 treatment from 16 somites to 48 hpf causes complete failure of ISV formation (n = 10) compared with normal sprouting after similar DMSO treatment (n = 13). By contrast, removal of SU5416 at 30 hpf, after ISV sprouting has failed, restores ISV sprouting (n = 10). Addition of SU5416 from 30 hpf had no significant effect on ISV number (n = 10). (D and E) Lateral view images showing the phenotype of sibling or tmem2hu5935 mutant embryos at (D) 28 hpf pre-injection and (E) 42 hpf following HA'se or o-HA injection. Scale bar, 100 μm. (F) Scatterplot demonstrating no difference in number of ISVs in sibling embryos injected with dextran (n = 11), HA'se (n = 10), or o-HA (n = 8) at 28 hpf and measured at 42 hpf; however, tmem2hu5935 mutant embryos have significant restoration of ISV number following injection of HA'se (n = 9) or o-HA (n = 10) compared with dextran control (n = 20). ∗∗∗∗p < 0.0001. Error bars represent ±SD. |
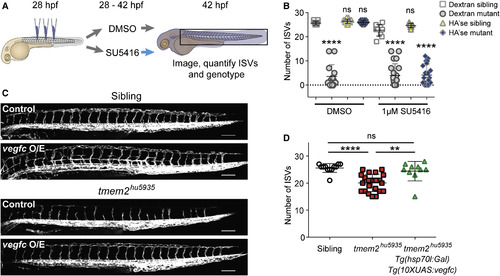
Restoration of ISV Sprouting by HA'se Requires Vegf Signaling, and Vegf Signaling Is Sufficient to Rescue the tmem2 Mutant Phenotype (A) Experimental strategy for HA'se and Vegf pathway epistasis experiments. (B) Scatterplots demonstrating that, as observed in Figure 6D, the significant reduction in ISV number in tmem2 mutant embryos (n = 14) compared with siblings (n = 11) is rescued when HA'se is injected into mutants (n = 16) compared with siblings in the presence of DMSO (n = 18). When embryos are incubated with SU5416 from the time of injection, tmem2 mutants (n = 21) have significantly fewer ISVs than siblings (n = 10) when injected with dextran but tmem2 mutants (n = 21) also have significantly fewer ISVs than siblings (n = 9) when injected with HA'se, demonstrating that rescue by HA'se requires intact Vegf signaling. (C) Lateral view images of sibling and tmem2hu5935 mutants on the Tg(kdrl:EGFP) background either negative for Tg(hsp70l:gal4)/Tg(10xuas:vegfc) (control) or positive for Tg(hsp70:gal4)/Tg(10xUAS:vegfc) (vegfc O/E). Scale bar, 100 μm. (D) Scatterplot showing number of ISVs in sibling (open circles; n = 10) and tmem2hu5935 mutants (red squares; n = 22) negative for vegfc O/E, showing a significant reduction in ISV number. tmem2hu5935 mutants positive for vegfc O/E (green triangles, n = 10) had significantly more ISVs than tmem2hu5935 mutants negative for vegfc O/E and were not significantly different from siblings negative for vegfc O/E. ∗∗p < 0.01, ∗∗∗∗p < 0.0001; ns, not significant. Error bars represent ±SD. |

Related to Figure 1: The Vegf pathway and tmem2 do not regulate one another at the transcriptional level. A. Whole genome sequencing based mapping of mutant uq1ks (derived from a forward genetic screen for venous sprouting defects) showing linkage to a region of Chromosome 5 containing tmem2. Sequence analysis identified a truncating mutation (Q616X) in tmem2. B. Protein schematic showing the predicted resultant protein in uq1ks. C. Whole genome sequencing based mapping of mutant uq2ks showing linkage to a region of Chromosome 5 containing tmem2. Sequence analysis identified a mutation in intron 6 (IVS6-9T>A) affecting the splice acceptor site in exon 7. D. Protein schematic showing the predicted resultant protein in uq2ks. E. Lateral views of sibling and tmem2hu5935 mutant trunks stained by ISH for arterial (hey2; n=38) and venous (dab2; n=46) markers showing no alteration in expression. F. Lateral views of sibling and tmem2hu5935 mutants on the Tg(kdrl:eGFP) background showing mild (>15 ISVs), medium (5- 15 ISVs) and severe (<5 ISVs) phenotypes. Scale bar = 100 μm G. Pie charts showing significantly greater severity of phenotype in tmem2hu5935 mutants following suboptimal Vegf inhibitor (SU5416) treatment compared with DMSO treatment (p<0.001 by Chi-square analysis; n=37 DMSO, n=46 SU5417), according to the categories depicted in F. H. ISH expression analysis for Vegf pathway members vegfaa, kdrl and flt4 in sibling and tmem2hu5935 mutant embryos showing no difference in expression patterns of levels. Reciprocally, tmem2 expression was unchanged in vegfaa and kdr/kdrl morphants. |

Related to Figure 1: vISV sprouting is correctly patterned following disruption of Bmp signaling and Bmp signaling is unaltered in tmem2 mutants. A. Lateral view images of 3 dpf Tg(flt1:YFP)/Tg(lyve:DsRed) trunk vasculature in Tg(hsp70l:noggin3) positive and control embryos, heatshocked at 28 hpf for 1 hour, showing normal arterial and venous sprouting under both conditions. Scale bar = 30 μm B. Scatter plots showing quantification of sprouts from the PCV in Tg(hsp70l:noggin3) negative (n=9) versus positive (n=8) embryos (n.s= not significant). C. Whole-mount immunofluorescence staining for pSmad1/5/8 positive cells co-localised with ECs labeled in the Tg(kdrl:eGFP) line in sibling and tmem2 mutant embryos. Scale bar = 5 μm D. Cell counts of EC positive for pSmad1/5/8 show no significant difference between sibling (n=8) and tmem2 mutants (n=8). E. Fluorescence intensity of pSmad1/5/8 positive ECs show no significant difference between sibling (n=14) and tmem2 mutants (n=11). F. Fluorescence intensity of pSmad1/5/8 positive cells was also not significantly different in non-ECs between sibling (n=38) and tmem2 mutants (n=38). Error bars represent ±SD |
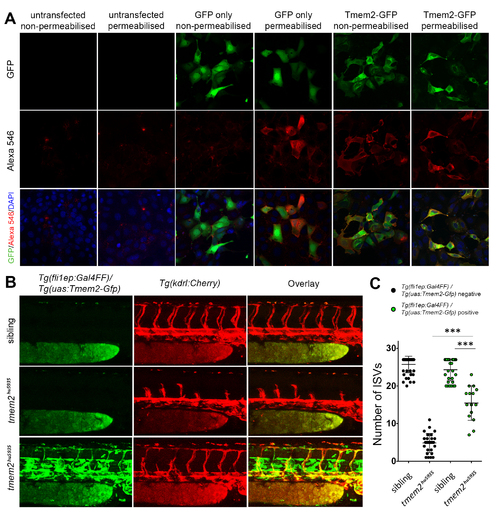
Related to Figure 2: The C-terminus of Tmem2 is localized extracellularly and Tmem2 can function in endothelial cells autonomously. A. Permeabilisation experiment showing that mammalian cells transfected with GFP alone require permeabilisation to detect GFP using anti-GFP red immunofluorescence. Human Tmem2-GFP, by contrast, does not require permeabilisation for GFP detection, indicating that the C-terminal GFP tag localizes extracellularly. B. tmem2hu5935 mutant embryos had significantly more ISVs when overexpressing Tmem2-Gfp in the endothelium using the Tg(fli1ep:Gal4) / Tg (uas:Tmem2-Gfp) lines crossed onto the Tg(kdrl:mCherry) background, showing that Tmem2-Gfp expressed from a local endothelial source was sufficient to partially rescue angiogenesis. C. Quantification of the ISV phenotype in sibling (n=30 with; n=30 without) and tmem2hu5935 mutants with (n=14) and without (n=28) the presence of fli1ep-driven Tmem2-Gfp expression. ∗∗∗p < 0.0001; Error bars represent ±SD. |
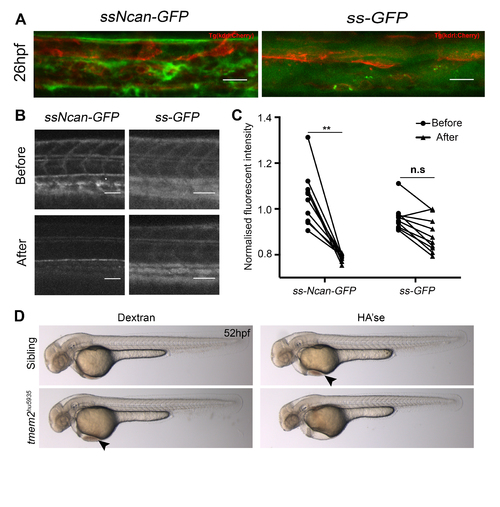
Related to Figure 3: Validation of the HA sensor and demonstration of cardiac defects following Hyaluronidase treatment A. ssNcan-GFP localizes perivascularly whereas secreted GFP (ssGFP) disperses extracellularly and is found within the vascular lumen. Scale bar = 20 μm. B. Degradation of the substrate, HA, by Hyaluronidase treatment. Scale bar = 50 μm. C. A significant reduction in the fluorescence intensity of ssNcan-GFP (n=9) is observed following Hyaluronidase treatment whereas no significant difference is observed in ssGFP expressing embryos (n=10) treated with Hyaluronidase. D. Brightfield images of Dextran injected or Hyaluronidase injected sibling and mutant embryos. Hyaluronidase treatment does not rescue the cardiac defect in tmem2hu5935 mutant embryos and induces cardiac defects in sibling mutants. Mutant hearts have cardiac looping defects, resulting in pooling of blood in the pericardium at the location of the inflow tract (black arrowhead). Cardiac looping proceeds in sibling embryos injected with Hyaluronidase however blood does accumulate in the pericardium (black arrowhead; due to blood regurgitation between the chambers) and eventually results in cardiac oedema. The cardiac looping defect in tmem2 mutants injected with Hyaluronidase does not correct and cardiac oedema is more severe. ∗∗p < 0.01. |
Reprinted from Developmental Cell, 40, De Angelis, J.E., Lagendijk, A.K., Chen, H., Tromp, A., Bower, N.I., Tunny, K.A., Brooks, A.J., Bakkers, J., Francois, M., Yap, A.S., Simons, C., Wicking, C., Hogan, B.M., Smith, K.A., Tmem2 Regulates Embryonic Vegf Signaling by Controlling Hyaluronic Acid Turnover, 123-136, Copyright (2017) with permission from Elsevier. Full text @ Dev. Cell