
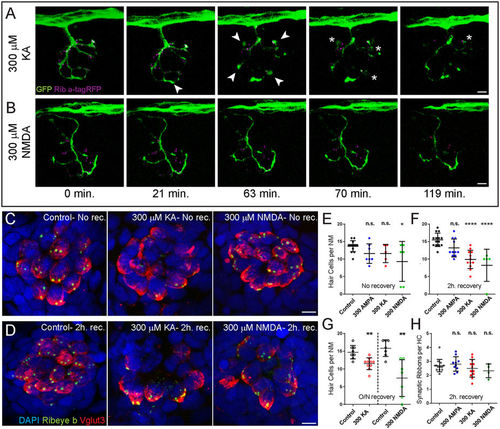
Exposure to KA or NMDA initiates hair-cell loss, but not synaptic-ribbon loss. (A,B) Live-imaging of KA (A) or NMDA (B) exposure: Representative frames from a movie taken over 2 hours with one frame per 3.5 minutes. Each frame is a maximum intensity projection (z-stack top-down image) of posterior lateral-line (LL) NM3 in a 6 dpf transgenic larva expressing Ribeye a-tagRFP in hair cells and GFP in afferent nerve fibers. Arrowheads in (A) indicate afferent-terminal swellings; asterisks indicate bursting afferent terminals. (C,D) Representative maximum intensity top-down (x-y) projections of imunolabeled Vglut3 (red) labeling the basolateral-end of hair cells and Ribeye b (green) labeling synaptic ribbons in NM3 of 6 dpf larvae. Larvae were exposed to DMSO carrier alone (Control) or iGluR agonists for 1 hour, then either immediately fixed ((C); No rec.) or rinsed and allowed to recover for 2 hours ((D); 2 h. rec.). Hair-cell death was confirmed by absence of DAPI-labeled nuclei. Scale bars: 3 μm (E–H) The number of intact hair cells per NM (E–G) or number of synaptic ribbons per hair cell (H) in 6 dpf (E,F,H) or 7 dpf (G) larvae exposed to DMSO alone or 300 μM iGluR agonist. Each circle represents NM3 in an individual larva. There was no significant loss of hair cells in NMs following exposure to AMPA at any time-point or the more excitotoxic AMPA/Kainate receptor agonist KA immediately following exposure (E). However, there were significantly fewer hair cells per NM in KA and NMDA-treated larvae compared to control 2 hours after drug exposure (F; ****p < 0.0001 defined by Dunnett’s multiple comparisons test) and after 20–22 h. recovery post-exposure (G, **p < 0.01 defined by unpaired t test). There was no significant difference in the number of synaptic ribbons per hair cell 2 h. after drug exposure (H), defined by Dunnett’s multiple comparisons test). |
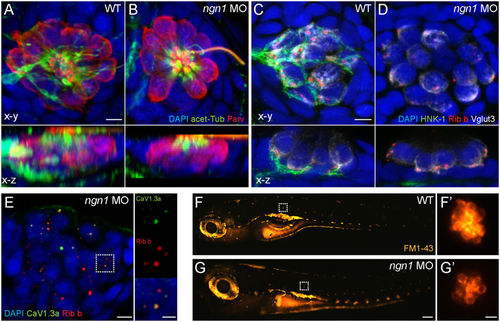
Characterization of ngn11 morphant NM hair cells. (A,B) Representative max intensity top-down (x-y) and side-view (x-z) projections of imunolabeled Parvalbumin (red) labeling hair cells, acetylated-Tubulin (green) labeling neurons and the apical-region of hair cells, and DAPI labeling nuclei in posterior LL NM2 of WT (A) or ngn1 MO (B) 5 dpf zebrafish larvae. Note the absence of immunolabeled green neurites beneath hair cells in the ngn1 morphant NM (x-z) image. Scale bar: 3 μm (C,D) Representative immunoabeled (x-y) and (x-z) cross-sections of a WT (A) or ngn1 MO(A’) anterior NM. Both synaptic ribbons (Ribeye; red) and synaptic vesicles (Vglut3; white) localize to the basolateral end of ngn1 MO hair cells, despite the lack of afferent innervation (HNK-1; green). Scale bar: 3 μm (E) Max-intensity(x-y) projection of imunolabeled synaptic ribbons (red) and the presynaptic calcium channel CaV1.3a (green) in NM3 of a 5 dpf ngn1 morphant larva. Insets show colocalization of Ribeye and CaV1.3, which is a hallmark of hair-cell maturation. Scale bars: 3 μm, 1 μm (insets) (F,G) Representative lateral views of 5 dpf WT (F) or ngn1 morphant (G) larvae briefly exposed FM1-43. Insets show higher magnification top-down views of the NMs indicated by the white dashed squares. Labeling with FM1-43 indicates functional mechanotransduction machinery in ngn1 morphant hair cells. |
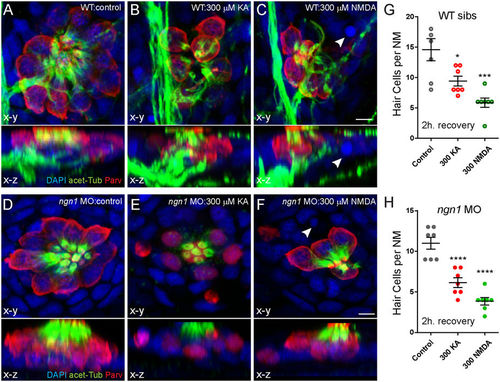
KA or NMDA exposure initiates hair-cell loss in ngn11 morphants comparable to WT siblings. (A–F) Representative max intensity top-down (x-y) and side-view (x-z) projections of imunolabeled Parvalbumin (red), acetylated Tubulin (green), and DAPI (blue) in posterior LL NM7 of 5 dpf WT (A–C) or ngn1 MO (D–F) larvae. Larvae were exposed to DMSO carrier alone (Control) or iGluR agonists for 1 hour, then rinsed and allowed to recover for 2 hours. Exposure to 300 μM KA (B,E) or 300 μM NMDA (C,F) leads to hair-cell loss in both WT and morphants. White arrowheads indicate pyknotic nuclei. Scale bar: 3 μm (G,H) The number of intact hair cells per NM in 5 dpf larvae exposed to DMSO alone, 300 μM KA, or 300 μM NMDA. Each circle represents NM2 or NM7 in an individual larva. There were significantly fewer HCs per NM in KA and NMDA-treated larvae compared to control 2 h. after exposure in both WT siblings (G) and ngn1 (H) MO larvae (*p < 0.05; ***p < 0.001; ****p < 0.0001 defined by Dunnett’s multiple comparisons test). PHENOTYPE:
|

ZFIN is incorporating published figure images and captions as part of an ongoing project. Figures from some publications have not yet been curated, or are not available for display because of copyright restrictions. PHENOTYPE:
|
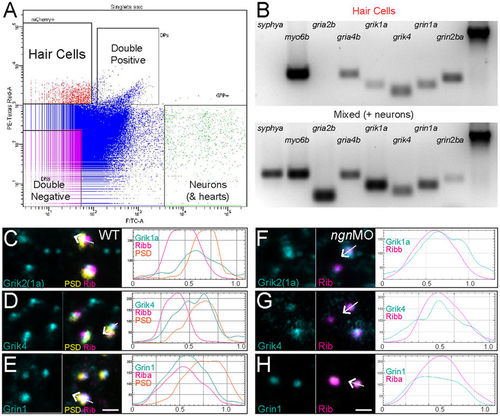
AMPA-, Kainate-, and NMDA-receptor subunits are expressed in zebrafish hair cells. (A) Fluorescence-activated cell sorting: fluorescent scatter was used to separate cell populations according to the fluorescent intensity of mcherry (hair cells) or GFP (neurons and hearts). (B) Gene expression analysis of isolated mcherry-expressing hair cells relative to the GFP-expressing mixed cell population. Gel images were cropped and inverted for display. The presence of myo6b expression was used as a positive control for hair cells and the absence of syphya expression was used as a negative control to ensure the sorted hair cell population was free of neurons. β-actin (far-right lane) was used as a loading control. Unedited gel images can be found in Supplementary Info. (C–E) Representative max-intensity images of immunolabeled wild-type hair-cell synapses: GluR subunits (cyan), synaptic ribbons labeled with Ribeye (magenta), and PSDs labeled with MAGUK (yellow). The antibody used to detect Grik1a was generated using a conserved region of the C-terminus of human Grik2 that has 92% percentage sequence conservation with zebrafish Grik1a (ClustalW). To the right of each image are corresponding profile plots showing fluorescent signal intensity (y-axis) in relation to distance (x-axis; μm). The white arrow in each merged image indicates the position and direction of the sampling line used to measure each corresponding profile plot. Note that immunolabel for and Kainate-receptor subunits Grik1a (C) and Grik4 (D) show multiple peak intensities that overlap with both Ribeye and MAGUK, while the NMDA-receptor subunit Gria1a (E) shows a single peak intensity that mostly overlaps with Ribeye. (F–H) Representative max-intensity images of immunolabeled ngn1MO hair-cell synapses. To the right of each image are corresponding profile plots. Note the immunolabel for Grik1a (F), Grik4 (G), and Grin1 (H) is present in the absence of postsynaptic densities and overlaps with synaptic ribbons. Scale bars: 1 μm. EXPRESSION / LABELING:
|
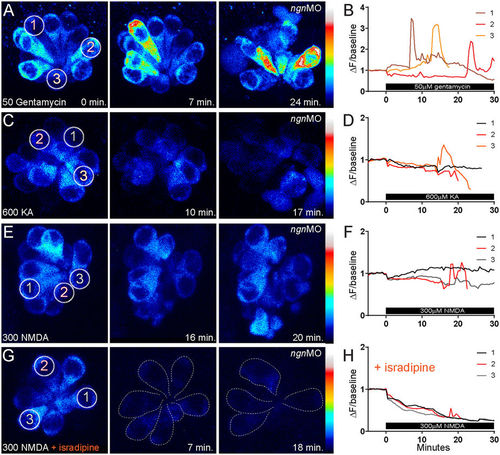
Cytoplasmic Ca2+ dynamics in hair cells treated with gentamycin vs. KA or NMDA. (A,C,E,G) Heat-mapped, time-lapse imaging of ngn1 morphant NMs with hair cells stably expressing GCaMP3. Z-stack images were taken every 30 seconds for 30–50 minutes total. 50 μM gentamycin (A), 600 μM KA (C) or 300 μM NMDA (E,G) was applied 5 minutes into imaging; 10 μM isradipine (G) was applied prior to imaging and remained for the duration. Circles indicate the regions of interest (ROIs) where fluorescence changes in GCaMP3 were measured. Numbers correspond to cells measured for fluorescence intensity traces. Dashed outlines in (H) indicate hair cells; note the reduction in hair-cell number during NMDA exposure. (B,D,F,H) Transformed (ΔF/baseline) fluorescence intensity data. Three cells from each NM are depicted; the red and orange traces correspond to dying hair cells. Cells were chosen to highlight the difference in calcium transients in dying cells exposed to genatmycin (B) vs. iGluR agonists (D,F). Note the reduction in intracellular calcium in (H) does not provide protection from hair-cell death. |
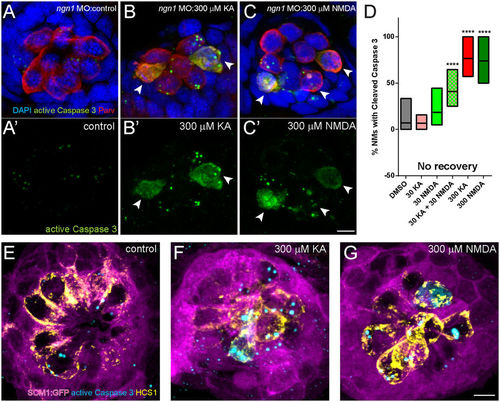
KA and NMDA exposed NMs contain hair cells with activated Caspase-3. (A–C): Representative max intensity top-down (x-y) images of NM7 in 5 dpf ngn1 morphant larvae exposed to DMSO alone (A), 300 μM KA (B), or 300 μM NMDA (C), then immediately processed for histology. NMs exposed to iGluR agonists stained positively for activated Caspase-3, indicating the cells were undergoing apoptotic cell death. Scale bar: 3 μm (D) Floating bar graph showing the percentage of NM in individual larval posterior lateral line that stained positive for activated Caspase-3. Each bar represents the min. and max. values in 11–15 larvae; the lines represent the mean values. (****p < 0.0001 defined by Dunnett’s multiple comparisons test). (E–G) Representative max intensity images of NMs in transgenic 5 dpf larvae expressing GFP in lateral-line supporting cells (scm1:GFP) exposed to DMSO alone (E), 300 μM KA (F), or 300 μM NMDA (G), then then immediately processed for histology. Supporting cells (magenta) appear intact in drug-exposed larvae, and activated caspase-3 immunolabel (cyan) corresponds with the hair-cell marker HCS-1 (yellow). Scale bar: 3 μm. |
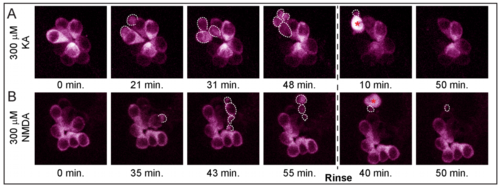
A subset of hair cells in KA- and NMDA-exposed NMs form apoptotic bodies prior to cell death. A-B) Max projection z-stack images from live-imaging of an NM in neurog1 morphant larvae with hair cells stably expressing GCaMP3. Z-stack images were taken every 30 seconds for 2.5 hours total; 300 μM KA (A) or 300 μM NMDA (B) was applied for 50 minutes, then rinsed with E3 media which remained for the duration of imaging. White dashed outlines indicate dying hair-cells blebbing and fragmenting into apoptotic bodies. |