
- Title
-
A single identified glomerulus in the zebrafish olfactory bulb carries the high-affinity response to death-associated odor cadaverine
- Authors
- Dieris, M., Ahuja, G., Krishna, V., Korsching, S.I.
- Source
- Full text @ Sci. Rep.
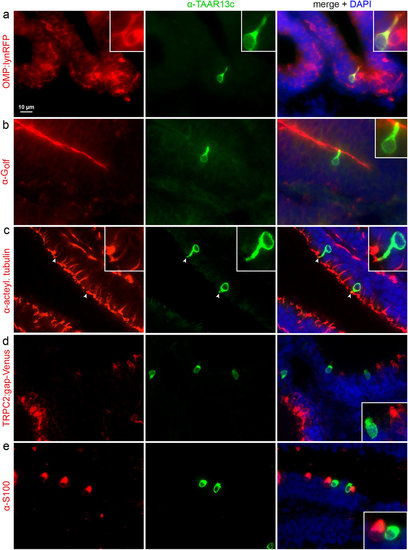
TAAR13c-positive neurons express ciliated markers, but not those of other OSN populations. Horizontal sections of adult zebrafish olfactory epithelium were double-labelled with several cell type markers (left column, red fluorescence) and TAAR13 antibody (middle column, green fluorescence). Right column, merged images shown together with DAPI (blue fluorescence). Insets show single cells at higher magnification. (a) TAAR13c-positive cells are also positive for OMP in the OMP:lynRFP transgenic line. (b) The dendritic knob of TAAR13C-positive neurons is also labelled by Golf antibody, as seen by the yellow color. (c) The dendritic knob of TAAR13c-positive neurons is labelled with acetylated tubulin antibody (arrowheads). (d) No overlap is seen between TAAR13c antibody staining and TRPC2 expression as visualized in the TRPC2:gap-Venus transgenic line (here represented as red for consistency reasons). (e) No overlap is seen between TAAR13c and S100 antibody staining. EXPRESSION / LABELING:
|
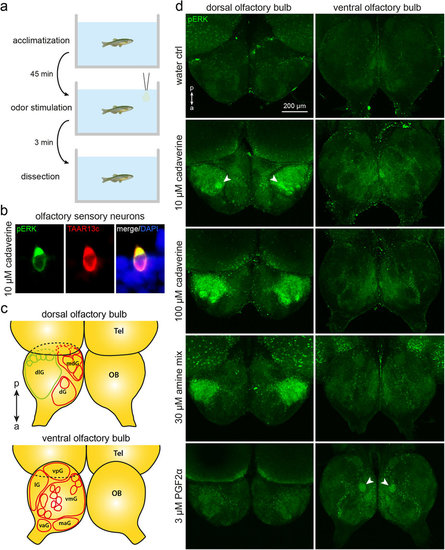
Odor-induced neuronal activation shown by pERK immunohistochemistry in whole mounts of zebrafish olfactory bulb. (a) The time course of the experiments is shown schematically. (b) Exposure to 10 μM cadaverine elicits robust and specific pERK antibody labelling of TAAR13c-positive neurons, consistent with previous observations8. (c) A schematic drawing of the olfactory bulb (OB; drawn using main positional information from ref. 4) shows the main glomeruli and glomerular groups (dlg, dorsolateral cluster; dG, dorsal cluster; mdG, mediodorsal cluster; lG, lateral chain; vpG, ventroposterior glomerulus; vmG, ventromedial glomeruli; vaG, ventroanterior glomerulus; maG, medioanterior cluster) visible from the dorsal (top scheme) and ventral (bottom scheme) side of the olfactory bulb; Tel, telencephalon; a↔p, anterio-posterior axis. (c) pERK levels (green) are visualized by immunohistochemistry. All pictures show maximum projections from confocal z-stacks of the bilateral olfactory bulb, as seen from dorsal (left column) or ventral (right column). Weak diffuse background fluorescence is present in all assay conditions. Top row, no activated glomeruli were seen in the negative control (water as stimulus). Second row, 10 μM cadaverine activates few glomeruli, one of them strongly (arrowhead). Third row, 100 μM cadaverine activates many glomeruli within the dorsolateral cluster. Fourth row, a mix of amines results in a strong activation restricted to the dorsolateral cluster. Bottom row, 3 μM PGF2α activates a single glomerulus (arrowhead) in the ventral olfactory bulb. |
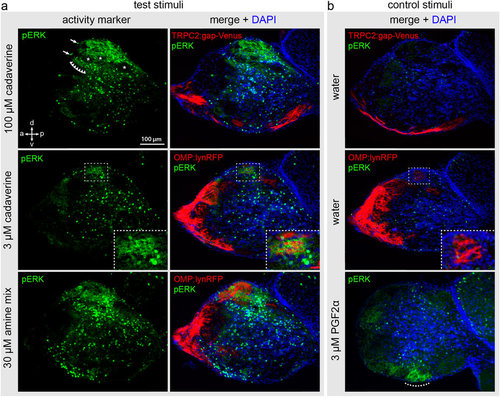
Adult fish were exposed to odor as shown in Fig. 3 and cryostat sections of the olfactory bulb were processed for immunohistochemical detection of pERK. The sections with maximal pERK signal for the respective odor are shown. (a) Top row, exposure to high level of cadaverine (100 μM); middle row, exposure to low level of cadaverine (3 μM); bottom row, exposure to a mix of 13 different amines (30 μM). Left column of panel (a) shows the pERK signal, right column shows the pERK signal merged with DAPI and the cell type markers TRPC2 and OMP as indicated on the panels. Note a strong signal in dorsal glomeruli for high cadaverine and the amine mix, and a much more restricted dorsal signal for the low cadaverine concentration. (b) Stimulation with water as negative and PGF2α as positive control as indicated. No pERK labelling is visible in the water control in both the TRPC2:gap-Venus and OMP:lynRFP transgenic lines (both shown as red fluorescence for consistency reasons). PGF2α activates a ventral glomerulus (dotted line), as described in ref. 18. Arrows indicate exemplary pERK-labelled cell bodies in the OB. Row of triangles shows a weak labelling of the neuropil in the vicinity of the dlG. Asterisks point out pERK-negative glomeruli interspersed with the active glomeruli in the dlG. Dashed boxes in the middle row show enlarged views of the single-cadaverine responsive glomerulus, which is pERK-positive after stimulation with 3 μM cadaverine and pERK-negative in the negative control. |
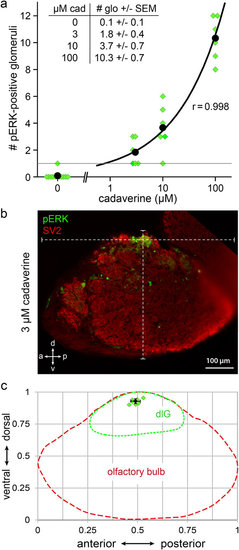
A single invariant glomerulus is activated by exposure to low concentrations of cadaverine. (a) Number of glomeruli activated in response to different doses of cadaverine was counted from sections. Water did not evoke any pERK signal in the dorsolateral cluster in all but one cases (n = 12). At 3 and 10 μM cadaverine one to few glomeruli were labelled (see table inset). At 100 μM cadaverine about 10 glomeruli were labelled (n = 6 for each cadaverine concentration used). (b) Exemplary image of a single glomerulus labelled by pERK, double labelling with SV2 to visualize all glomeruli in this section. White dashed lines intersect in the glomerulus center and show overall a↔p and v↔d length of the olfactory bulb section used for calculating the normalized glomerulus position. (c) Schematic representation of the dlGcad coordinates measured in the olfactory bulb. Red and green dashed lines represent olfactory bulb and dorsolateral cluster contours, respectively. Green squares represent single measurements from 7 different bulbi. Black square and error bars represent mean value ± SD. EXPRESSION / LABELING:
|
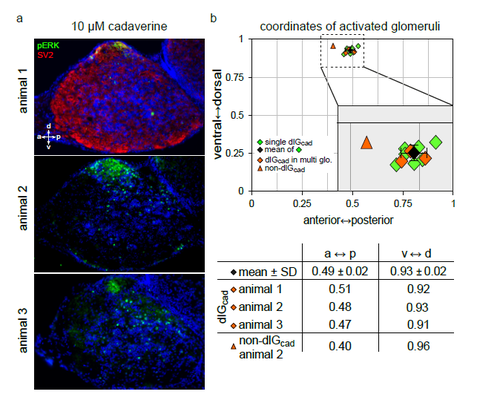
The dlGcad can also be found in bulbi with multiple pERK-labelled glomeruli a) α-pERK labels active glomeruli in cryostat sections of the olfactory bulb from 3 different animals stimulated with 10 μM cadaverine. b) Top panel, mapped glomerular positions are shown in the coordinate system used. Green squares, glomerular position, when only a single glomerulus was labelled (n=7, from 3 animals exposed to 3 μM and 1 animal exposed to 10 μM cadaverine, respectively); black square and error bars, average position ± SD; orange squares, three examples for dlGcad positions in cases where multiple glomeruli were labelled; orange triangle, an adjacent non-dlGcad glomerulus. Note the unambiguous identification of the dlGcad glomerulus in all three cases with multiple labelled glomeruli, and the clear distinction even to the directly adjacent non-dlGcad glomerulus (this was the only case in which a non-dlGcad glomerulus was situated in the same section as the dlGcad glomerulus). Bottom panel, numeric values for coordinates of dlGcad and non-dlGcad glomeruli in experiments with multiple glomeruli labelled (orange symbols). For comparison the mean value for the 7 cases, in which a single glomerulus was labelled, is shown (black square). Note the clear distinction between positions of dlGcad and non-dlGcad glomeruli. |
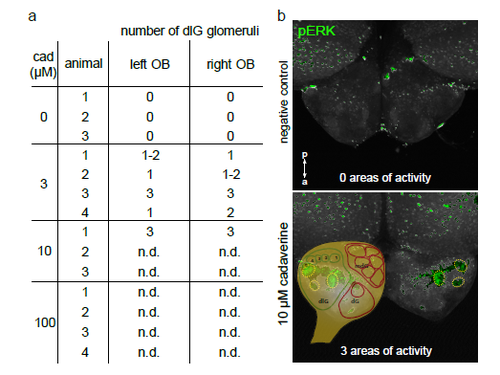
Pronounced left-right symmetry of activated glomeruli In whole mount experiments we compared number and position of pERK-labelled glomerular-shaped areas in the left and right olfactory bulb. a) Table with numbers of activated glomeruli. In all cases, where delineation of glomeruli was unambiguously possible (all experiments with 3 μM, and one with 10 μM cadaverine), we observed a (nearly) equal number of glomeruli labelled on each side. b) Images show pERKlabelling in negative control (top panel) and after exposure to 10 μM cadaverine (bottom panel). Olfactory bulbs are shown from the dorsal view. Activated glomeruli are outlined by dashed circles both in left and right olfactory bulb. A schematic glomerular map (drawn using main positional information from4) was made partially transparent and placed over the left olfactory bulb to visualize the position of cadaverine-responsive glomeruli in the dorsolateral cluster. n.d., not determined: an unambiguous identification of single glomeruli was impossible due to high signal density in the whole mount preparations. |