
- Title
-
Maternal cortisol stimulates neurogenesis and affects larval behaviour in zebrafish
- Authors
- Best, C., Kurrasch, D.M., Vijayan, M.M.
- Source
- Full text @ Sci. Rep.

Excess zygotic cortisol content affects neurogenesis. (A) A schematic of zebrafish brain showing the regions used for assessing neurogenesis. The regions, including P (pallium) and Po (preoptic region), highlighted in red were, used for assessing neurogenesis. Position of transverse section selected for further analysis is shown by a blue line. See SI Table 1 for full list of abbreviations. Adapted from Mueller and Wulliman66. Neurogenesis in zebrafish pallium (B) and preoptic region (C). Larvae were pulsed with EdU at 24 hpf and raised until 120 hpf. A representative image contains outlines of the regions of interest (white dashed line). Representative sections for vehicle and control groups are shown, with staining for HuC (green), EdU (red) and both merged. Examples of cells co-labelled with EdU and HuC are indicated with arrowheads. Cells were counted by region and total number of new neurons (EdU + HuC) at 24 hpf and was normalized to total number of neurons (HuC). Means ± SEM (n = 3–5 larvae). Different letters indicate significant differences (Student’s t-test). |
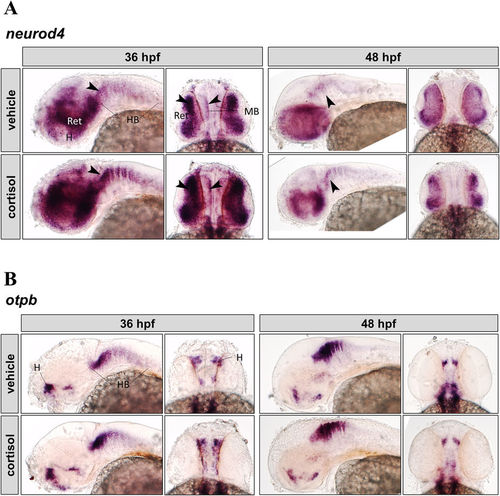
Cortisol effect on neurod4 and otpb expression in zebrafish embryos. Whole-mount in situ hybridization of neurod4 (A) and otpb (B). Representative images (left, lateral view; right, dorsal view) are shown for each treatment (vehicle: top, cortisol: bottom) and time point (36 hpf: left, 48 hpf: right) on each panel. Regions indicated on vehicle controls (H, hypothalamus; Ret, retina; MB, midbrain; HB, hindbrain). Arrowheads indicate regions with differential expression; see text for details. |

Neurogenesis in the rostral hypothalamus, posterior tuberculum, and dorsal thalamus in larvae with altered cortisol deposition. Larvae were pulsed with EdU at 24 hpf and then raised until 5 dpf. A representative image as well as an overlay of staining is shown for each region quantified (control), with a representative image from the cortisol-treated group (A). Regions quantified are (B) rostral hypothalamus, (C) posterior tuberculum, and (D) dorsal thalamus. Red is EdU staining, green is HuC staining and blue is DAPI staining. Values represent means ± SEM, and different letters indicate significant differences (Student’s t-test, unpaired, n=4-5). |