
- Title
-
The Descending Diencephalic Dopamine System Is Tuned to Sensory Stimuli
- Authors
- Reinig, S., Driever, W., Arrenberg, A.B.
- Source
- Full text @ Curr. Biol.

Synchronous Spontaneous Activity of Dopaminergic Cell Subgroups in the Diencephalon (A) Schematic of diencephalic dopaminergic subgroups. Far-projecting posterior tubercular neurons are marked in blue, and predominantly locally projecting hypothalamic neurons are marked in red. PO, preoptic area. (B) Colocalization of tyrosine hydroxylase (TH) and GCaMP7a. Anti-GFP (detects GCaMP7a) and anti-TH immunofluorescence stain of a Tg(th:Gal4VP16)m1233, Tg(UAS:GCaMP7a)zf415Tg larva (ventral diencephalon, 4 dpf, z-projections). (C) In vivo calcium imaging of dopaminergic neurons in the diencephalon. (C1) Mean ΔF/F heatmap of a calcium image time series. (C2) Standard deviation time series projection visualizing active, expressing neurons was solely used to identify neurons for further analysis. (D) Calcium signals (ΔF/F) of the marked cells of different dopaminergic subgroups shown in (C2). (E–H) Cross-correlations of spontaneous calcium activity in cell pairs of the same dopaminergic subgroup (E and H) and different subgroups (F and G). The black and white bars each indicate different recordings, i.e., all cell pairs from one contiguous black or white bar belong to the same recording. Rostral far-projecting neurons in PTar and PTac show synchronous activity (E and F), whereas PTar activity is only weakly correlated with activity in local Hdm dopaminergic neurons (G). Within Hdm, neural activity is synchronous (H). corr., correlation. (I) Mean correlation coefficients of all cell pairs within and across dopaminergic subgroups. The activity is only weakly correlated (blue) between far-projecting (PTar and PTac) and local hypothalamic groups (Hc and Hdm), while activity within the respective projection-type groups is synchronous (green to red). See also Figure S1 and Movie S1. |

Lateral Line Ablation Results in Loss of Stimulus Speed Tuning and in Attenuated Mechanosensory-Related Activity (A) Vital DASPEI stain visualizes hair cells and confirms their ablation in a neomycin-treated 5-dpf-old larva (neomycin incubation: 125 μM, 1 hr). (B) ΔF/F calcium activity of diencephalic dopaminergic neurons during tactile stimulation (Stim) trials in hair cell-ablated 5 dpf th:Gal4VP16; UAS:GCaMP7a larva. (C–E) The mean stimulus-evoked calcium activity (z-score) of stimulus-correlated neurons is plotted against time after stimulus onset for Ramp (blue) and Step (green) stimulation and for the different dopaminergic subgroups PTar (C), PTp (D), and Hdm (E). The solid line corresponds to dopaminergic activity in hair-cell-ablated larvae (abl), and the dashed line to dopaminergic activity in control larvae (ctrl). Shaded areas indicate SEM. (F–H) The mean time- and trial-averaged calcium activity (z-score) of all tactile stimulus-correlated dopaminergic neurons in response to different Ramp speeds in locomotion-free trials for the different dopaminergic subgroups PTar (F), PTp (G), and Hdm (H). The dots represent the mean calcium responses of single cells to a certain indicated speed of the Ramp stimulus. The black dashed lines mark the baseline activity (i.e., the average z-score for the 5 s preceding stimulation). Error bars indicate SEM. (I) The proportion of neurons correlated to tactile stimulation in control, hair-cell-ablated, and paralyzed larvae for Ramp and Step stimuli. (J) The mean calcium activity (z-score) of tactile stimulus-correlated neurons for all dopaminergic subgroups in control larvae and hair-cell-ablated larvae. (K) The mean calcium activity (z-score) of all neurons for all dopaminergic subgroups in control larvae and paralyzed larvae. Error bars indicate SEM. ∗p < 0.05; ∗∗p < 0.01, by Mann-Whitney U test with Bonferroni correction (comparisons, n = 6). See also Figure S6. |

(A-C) Calcium event detection method. (A) First, ΔF/F fluorescent traces (dashed gray) were low-pass filtered (cyan) and deconvolved (blue) by an exponential filter exp(-t/ τdecay ). The signals of a PTN and a Hdm cell are plotted as examples. (B) Then the noise level of the ΔF/F trace was determined by high-pass filtering (red line) and calculating the standard deviation. A threshold (green line) was set at 3 times the standard deviation. (C) All fluorescent values (low-pass filtered deconvolved ΔF/F) exceeding this threshold and continuing longer than 1 second (2 frames) were recognized as calcium event. (D) The median duration of calcium events for all dopaminergic subgroups. The error bars represent the 25% and 75% quantiles. (E) The median fraction of active time periods in percent. The error bars represent the 25% and 75% quantiles. **significant by Mann-Whitney-U-test (**p<0.01, *p<0.05, Bonferroni corrected; comparisons n=15. There was no significant difference between PTar and Hdm groups regarding the fraction of active time periods (p=0.01, > 0.05/15=0.003)). (F-H). Cross-correlations of single cell pairs of PTp, PTN and Hc cells. The cross-correlation is normalized between 0 to 1, which means if 2 cell pairs have the same activity pattern (e.g. in an autocorrelation) the cross-correlation at time point t = 0 s is 1. (I) Tail motion detection procedure from high-speed tail motion recordings of larval zebrafish. (1) The body axis and the tail line were defined (green line). (2) The absolute frame to frame difference of a high-speed camera recording of the tail (blue line) was determined. The red line represents the classification of time frames with and without tail motion. (3) From every frame with tail motion the median of the frames without tail motion was subtracted. (4) Based on a dynamical threshold (see methods, tail motion detection) pixels which are potentially part of the tail (white, denominated as ”tail pixels”) are determined. (5) Spatial median filtering was applied to remove noise. (6) The tail position was detected by a chain of midpoints (green) by maximizing the number of tail pixels in the neighborhood of each midpoint position. |
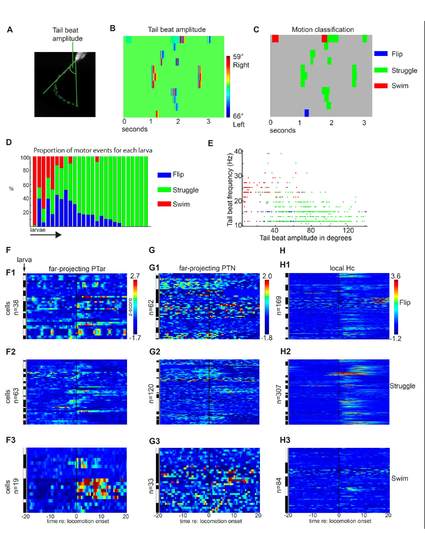
(A-C) Tail motion classification method. (A) The tail beat amplitude of a 4 dpf nacre-/- larva is extracted using the chain of tail midpoints described in Supplemental Figure S1I. (B) Tail beat amplitude heat map in which the x-axis corresponds to time and the y-axis to 11 different portions of the high-speed camera recording. (C) The tail beat amplitude (B) was used for classification of the locomotion patterns flip, struggle and swim. (D) Proportion of the three locomotor patterns in individual larvae. Each bar corresponds to a single recording of one larva. (E) Plotting the tail beat frequency versus tail beat amplitude for all spontaneous motor events recorded during 2-photon calcium imaging experiments. Each motor event is presented as a single dot in blue (flip), green (struggle) or red (swim). Spontaneous slow swim is clearly distinguished from struggle by smaller tail beat amplitude and higher tail beat frequency. (F-H) Median single cell calcium activity as z-score in a 40 second time frame centered around the onset of flip, struggle or swim behavior in the far projecting PTac, PTN and local projecting Hc dopaminergic subgroups. The white and black bars indicate different larvae. |
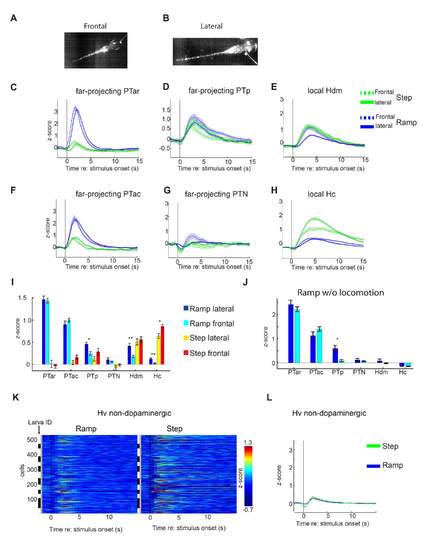
(A, B) High-speed camera single image of 4 dpf old larvae for frontal and lateral tactile stimulation on the head. The platinum wire and a small reflection on its tip are visible. (C-H) Mean calcium activity as z-score for all cells of the different dopaminergic subgroups for Ramp and Step stimuli applied laterally (solid line) or frontally (dashed line). Shaded areas correspond to the SEM. (I) Mean time-averaged calcium activity (see Statistics) as z-score for all cells of each dopaminergic subgroup for Ramp and Step head stimulation in the frontal and lateral stimulus configuration. While the stimulus location did not make a difference in most cases, laterally applied Ramp stimuli resulted in significantly stronger calcium responses in PTp, Hdm and Hc neurons, when compared to frontally applied ones, and frontally applied Step stimuli resulted in stronger responses than laterally applied ones in Hc (** p<0.01; * p <0.05, Mann-Whitney-U test, Bonferroni corrected, comparisons n=6) Error bars SEM. Number of neurons frontal/lateral: PTar 30/17; PTac: 42/26; PTp 27/27; PTN 50/13; Hdm 70/49; Hc 133/95. (J) Mean time-averaged calcium responses to frontal and lateral Ramp stimuli for trials in which no locomotion occurred. The lack of a stimulus position-dependent response difference in Hdm and Hc suggests that the differences observed in (I) are locomotion dependent. However, in PTp, the difference between responses to frontal and lateral Ramp stimuli is still significant (* p <0.05, Mann-Whitney-U test, Bonferroni corrected, comparisons n=6). Error bars: SEM. (K) Mean calcium activity (z-score) of single cells in the ventral hypothalamus (Hv) of 4 to 5 dpf old gSA2Az-Gal4FF; UAS:GCaMP7a larvae after the onset (t = 0 s, black line) of Ramp (left) and Step (right) stimuli. Black and white bars each indicate different animals. (L) Mean calcium activity of all cells of the Hv region synchronized to the onset of Ramp (blue) and Step (green) stimuli. The shaded area represents the standard error of the mean. The Hv region is devoid of dopaminergic neurons. |