
- Title
-
Early Commissural Diencephalic Neurons Control Habenular Axon Extension and Targeting
- Authors
- Beretta, C.A., Dross, N., Guglielmi, L., Bankhead, P., Soulika, M., Gutierrez-Triana, J.A., Paolini, A., Poggi, L., Falk, J., Ryu, S., Kapsimali, M., Engel, U., Carl, M.
- Source
- Full text @ Curr. Biol.

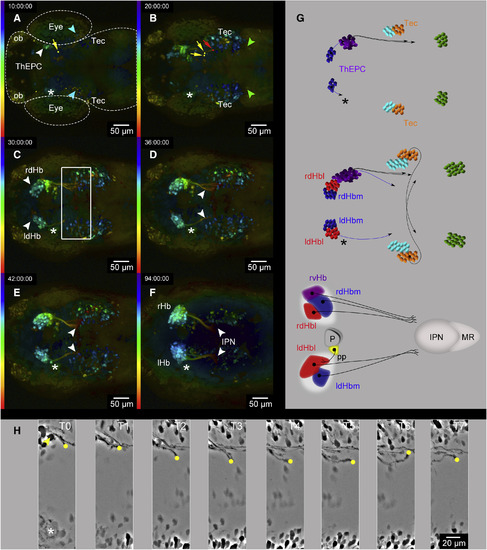
Long-Term 2-PM In Vivo Recording Identifies Two Intersected Neural Circuits (A–F) Dorsal view, anterior to the left, color-coded MIP, of six developmental stages acquired by in vivo 2-PM of Et(−1.0otpa:mmGFP)hd1 transgenic embryos. The LUT shows the z color-coded table according to the depth of each slice. The experiment time (hr:min:s) is shown in the left upper corner. Original stacks were cropped and gamma was adjusted to a value of 0.45 for display purposes. The head morphology has been roughly outlined in (A) for orientation. (A and B) White arrowheads mark the ThEPCs at (A) 32 hpf and (B) 44.5 hpf; blue and green arrowheads mark two posterior bilateral clusters of projecting neurons. Red and yellow dots and directional arrows mark the tips of ThEPC axons projecting ipsi- and contralaterally, respectively. Blue and green dots and directional arrows highlight tips of axons from the second and third cluster of contralaterally projecting neurons, respectively. (C) White arrowheads highlight the bilateral expression of GFP in dHb neurons and navigating dHb efferent axons at 49 hpf. (D and E) White arrowheads highlight dHb efferent projections (D) navigating toward the midline before IPN innervation at 53 hpf and (E) thereafter at 65 hpf. (F) Architecture of the habenular neural circuit at 5 dpf. (G) Summary of events during habenular neural circuit development between (top to bottom) 32 and 44.5 hpf, 32 and 53 hpf, and 32 hpf and 5 dpf. ThEPCs, purple; Tec, orange; second cluster of projection neurons, light blue; third cluster of projection neurons, green; ldHb/rdHb and axonal targets, blue/red. Some ThEPC neurons form the vHb [11]. Therefore, the lvHb/rvHb and axonal targets are shown in purple. Note that the schemes do not show the exact number or position of all axons. (H and I) Dorsal views, anterior to the left, focused on early ThEPC neural network formation between (H) 34.5 and 42 hpf and (I) 36 and 42 hpf. The dotted line indicates the embryonic midline. Yellow and red dots highlight the tips of a commissural and an ipsilaterally projecting ThEPC axon, respectively. Yellow and red arrowheads mark the corresponding projection neuron. MIPs were adjusted using the difference of Gaussians to better visualize the structure of interest. d, dorsal; Hb, habenula; Hbl, lateral habenula; Hbm, medial habenula; IPN, interpeduncular nucleus; l, left; LUT, lookup table; MR, median raphe; ob, olfactory bulb; P, pineal; pp, parapineal; r, right; Tec, optic tectum; ThEPC, thalamic-epithalamic early projecting cluster; v, ventral. See also Figures S1 and S2 and Movies S1 and S2. |
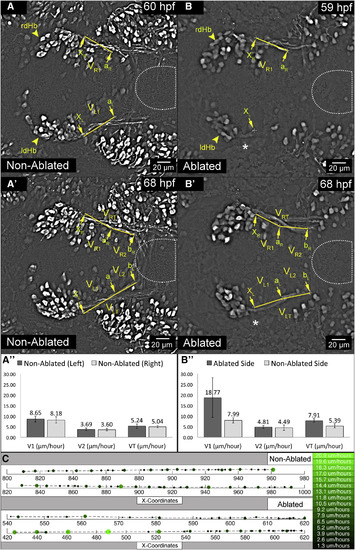
ThEPC Neurons Influence Initiation and Velocity of dHb Axon Elongation (A–B″) Dorsal views, anterior to the left, MIPs of two developmental stages acquired by in vivo 2-PM microscopy in (A and A′) non-ablated and (B and B′) left ThEPC-ablated Et(−1.0otpa:mmGFP)hd1 embryos. An asterisk marks the site of ablation. MIPs were adjusted using the difference of Gaussians to better visualize the structure of interest. The approximate location of the developing IPN is encircled. Yellow arrowheads highlight the position of dHb neurons. The original stacks were cropped and gamma was adjusted to a value of 0.60 for display purposes. Arrows on the right (R) and left (L) side indicate positions chosen for dHb axon growth measures. At positions xR and xL, dHb axons first emerge from the ThEPC in non-ablated embryos and on the non-ablated side in ablated embryos (not shown). aR and aL are the second position, which corresponds to the location of axon tips on the non-ablated side when axons on the ablated side reach xL. bR and bL are the third position, at which dHb axons stall in ablated embryos. VR, VL, VR1, VL1, VRT, and VLT symbolize axon elongation velocities in six (A″) non-ablated and (B″) ablated embryos. VLT and VRT were calculated by dividing the elongation distance of dHb efferent axons and time: (ΔxLbL)/Δt and (ΔxRbR)/Δt with VR1 or VL1 = (ΔxRaR or ΔxLaL)/Δt and VR2 or VL2 = (ΔaRbR or ΔaLbL)/Δt (see Table S1). The error bars represent the SD values of each velocity (V1, V2, VT). Note that measures were carried out in 2D projections and elongation velocity values are arbitrary. (C) Representative example of a 2D dHb axon-tracking plot generated using manual tracking data. Right axons are shown in the upper plot in non-ablated and ablated embryos, whereas the corresponding left axons are shown in the lower plot. Unilateral ablation was performed on the left. Larger and lighter green dots correspond to greater velocity. The right side bar shows the color-coded velocity in μm/hr. dHb, dorsal habenula; l, left; r, right; ThEPC, thalamic-epithalamic early projecting cluster. See also Figures S2–S4, Table S1, and Movie S3. |
Unilateral ThEPC Cell Ablation Causes the Arrest of dHb Efferent Axons on Both Brain Hemispheres (A–F) Dorsal view, anterior to the left, color-coded MIP of six developmental stages acquired by in vivo 2-PM after complete unilateral ThEPC ablation at 32 hpf in an Et(−1.0otpa:mmGFP)hd1 transgenic embryo. Left: the LUT shows the z color-coded table according to the depth of each slice. Original stacks were cropped and gamma was adjusted to a value of 0.60 for display purposes. The head morphology has been roughly outlined in (A) for orientation. (A) The yellow dot and arrow mark the tip of a ThEPC axon. The blue arrowheads highlight the position of the second cluster of commissural neurons. (B) The yellow dots and arrows mark the tips of axons starting to migrate toward the midline, but which turn subsequently. The red dot and arrowhead label the tip of an ipsilateral ThEPC axon. The green arrowheads highlight the position of the third cluster of commissural neurons. (C) White arrowheads show the bilateral expression of GFP in the dHb. A white square highlights the area in which dHb axon elongation stalls. Note the delay of dHb axons on the left side. (D and E) White arrowheads highlight the position of extending dHb efferent axons at (D) 68 hpf and (E) 74 hpf. (F) Architecture of the habenular neural circuit after left-sided ThEPC cell ablation at 5 dpf. White arrowheads mark the ends of the stalled dHb efferent axon bundles. (G) Summary of events during habenular neural circuit development after complete unilateral ThEPC ablation between (top to bottom) 42 and 52 hpf, 42 and 68 hpf, and 42 hpf and 5 dpf. ThEPCs and rvHb, purple; Tec, orange; second cluster of projection neurons, light blue; third cluster of projection neurons, green; ldHb/rdHb and axonal projections, blue/red. (H) Dorsal view, anterior to the left, MIPs of eight developmental stages focused on a turning commissural ThEPC axon on the non-ablated site. The axon’s tip is marked by a yellow dot and its neuron with a yellow arrowhead. Segmented images show events between 34 and 43 hpf. MIPs were adjusted using the difference of Gaussians to better visualize the structure of interest. Asterisks mark the site of ThEPC ablation between 32 hpf and 5 dpf. d, dorsal; Hbl, lateral habenula; Hbm, medial habenula; IPN, interpeduncular nucleus; l, left; MR, median raphe; ob, olfactory bulb; r, right; Tec, optic tectum; ThEPC, thalamic-epithalamic early projecting cluster; v, ventral. See also Figures S3 and S4 and Movie S3. |

Complete and Incomplete Unilateral ThEPC Cell Ablations Cause Differently Severe Bilateral IPN Innervation Defects (A–D) Dorsal view, anterior to the left, color-coded MIP of four developmental stages acquired by in vivo 2-PM after sequential unilateral ThEPC cell ablation at 32 hpf in an Et(−1.0otpa:mmGFP)hd1 embryo. The LUT shows the z color-coded table according to the depth of each stack. Original stacks were cropped and gamma was adjusted to a value of 0.60 for display purposes. (A) For orientation, white arrowheads mark the position of ThEPC neurons; blue arrowheads mark the second posterior bilateral cluster of projecting neurons. An asterisk marks the ablated side. (B) White arrowheads mark the left and right dHb. The blue dot and arrow mark the tip of a commissural tectal axon; red and yellow dots and arrows mark ipsilateral and commissural ThEPC axons, respectively. (C and D) White arrowheads and box indicate the area in which dHb axon elongation stalls upon complete ThEPC cell ablation at (C) 66 hpf and (D) 119 hpf. (E and F) Statistics of IPN innervation phenotypes observed after (E) 74 independent unilateral complete and (F) 28 sequential ThEPC cell ablations. Numbers above the columns correspond to the number of embryos showing the respective phenotype. (G–I) Dorsal views with anterior to the left showing normal IPN innervation (G) and examples of the indicated IPN innervation phenotypes after sequential unilateral ThEPC neuron ablations (H and I). Asterisks in (H) and (I) mark the site of ablation. d, dorsal; Hb, habenula; IPN, interpeduncular nucleus; l, left; r, right; Tec, optic tectum; ThEPC, thalamic-epithalamic early projecting cluster. See also Figures S3 and S4 and Movie S3. |

Characterisation of Et(-1.0otpa:mmGFP)hd1 transgenic embryos. (A-D) Dorsal views, Maximum Intensity Projections (MIPs), anterior to the top, focussed on the habenular nuclei of Et(1.0otpa:mmGFP)hd1 transgenic embryos. GFP expression (green) overlaps with (A) acetylated tubulin, (B) kctd12.1, (C) kctd8 and (D) kisspeptin-1 (red). (E) Lateral view, anterior to the left, MIP. Habenular efferent projections innervating their targets in the ventral midbrain at 4 dpf in an Et(1.0otpa:mmGFP)hd1 embryo. (F) Dorsal view, anterior to the left, MIP. Axonal projections innervating the MR (arrowheads) in an 3 dpf Et(1.0otpa:mmGFP)hd1 embryo. Nuclei (blue) are labelled with H2A-CFP. (G) Dorsal view, anterior to the left, MIP. Et(1.0otpa:mmGFP)hd1 embryo showing the emergence of GFP in dHb cells. Anterior and posterior white arrowheads show the dHb and ThEPC cells respectively. Green arrowheads show early dHb efferent axons extending into the ThEPCs. (H) Dorsal view with anterior to the top, MIP, of a 52 hpf Et(-1.0otpa:mmGFP)hd1 embryo labelled with cxcr4b (red) expressed in dHb progenitor cells. Yellow arrowheads indicate the dHb region containing cxcr4b positive cells and transgenic GFP expressing cells. White arrowheads mark the ThEPCs. (I-L) Lateral views focussed on the thalamic area, MIPs of 32 hpf Et(- 1.0otpa:mmGFP)hd1 embryos co-labelled (red) with (I) the prosomere 2 (dorsal thalamus and epithalamus) marker lhx2b [S1, S2], (J) the calcium binding protein Calretinin expressed in the nucleus of the median longitudinal fascicle [S3] and (K, L) the pretectal markers lhx1a and nr4a2a [S4-S6]. Images were cropped and the gamma was adjusted for display purposes. d, dorsal; dHbl, lateral dorsal habenula; dHbm, medial dorsal habenula; dpf, days post fertilization; HC, habenular commissure; IPN, interpeduncular nucleus; l, left; MR, median raphe; Nmlf, nucleus of the medial longitudinal fascicle; PT, pretectum; r, right; T, telencephalon; Tec, optic tectum; ThEPC, thalamic-epithalamic early projecting cluster; v, ventral; VT, ventral thalamus. |

Axon tracking. (A-F) Dorsal view, anterior to the left, colour coded MIP obtained from a total z-height of 301 μm focussed on ThEPC axons in an Et(-1.0otpa:mmGFP)hd1 embryo. Time points between 33 hpf and 49.5 hpf. The LUT shows the Z colour code table according to the depth of each stack. Original stacks were cropped and the gamma was adjusted for display purposes. White arrowheads show the location of ThEPCs at 33 hpf; blue and green arrowheads mark two posterior bilateral clusters of projection neurons. Manual tracking was performed using the Fiji manual tracking plugin, the overlay of dots and lines was used to highlight the position of ThEPC axons and axons originating from the second and third cluster of neurons. (A') ThEPC neurons at 32 hpf shortly after initiation of axon extension (white lines), two of which form commissures (asterisks). The axon of the lower marked neuron is tracked in green (A-E). (G-H') Lateral views, anterior to the left, focussed on the left ThEPC at developmental stages indicated. White arrowheads mark one dHb axon originating from a dHb neuron (asterisk). (G') Red arrowhead points at a potential contact between the dHb axon and a ThEPC neuron. (G, H) Original stacks were cropped and adjusted using difference of Gaussians. The LUT was inverted. (G', H') The stack is displayed in 3D using the alpha blending function in NIS Elements software (Nikon) and reoriented in xyz. The image was cropped and the 3D depth colour code applied to better visualise the structures of interests localised in the same focal plane. (I) Graphic illustration of dHb axons reaching the IPN at the same time in three embryos. Note that the time (hpf) is arbitrary as the visualisation of dHb axons at the IPN before innervation depends on the mounting orientation of the embryo. (J) Boxplots of axon velocities analysed in Fig. 2. The axon VT is significantly higher on the ablated side compared to the nonablated side. Red diamonds indicate the mean values. Shapiro-Wilk normality test for the non-ablated side (n = 9): W = 0.8974, p-value = 0.2373, and ablated side (n = 6): W = 0.9931, p-value = 0.9954. Welch Two Sample t-test: t = -5.9783, df = 9.687, pvalue = 0.0001548. (K) Statistical analysis of the effect size of ThEPC ablations on dHb axon velocity. Compared are the velocities of left and right axons in non-ablated and unilaterally ThEPC ablated conditions. The Cohen's distance analysis used corresponds to the distance in standard deviations between the mean value of dHb axon velocities. Values between 0 and 0.2 standard deviations indicate a small effect, 0.2 to 0.5 represent a medium effect and values bigger than 0.5 indicate a large effect. ldHb, left dosal habenula; LUT, Look Up Table; ThEPC, thalamic-epithalamic early projecting cluster. |

Control of ThEPC ablation accuracy (A, B) Lateral views focussed on one ThEPC (green), MIPs of 32 hpf Et(- 1.0otpa:mmGFP)hd1 embryos co-labelled with the thalamic marker lhx2b (red). (C-F) Failed-ablated embryos: Dorsal views, anterior to the left, MIPs of an Et(- 1.0otpa:mmGFP)hd1 embryo at 32 hpf (C) before and (D) after laser treatment (asterisk). Arrowheads highlight the ThEPC cells. (E, F) GFP expression in ThEPC cells recovered 2 hrs after treatment and (E) habenular formation and (F) IPN innervation proceeded normally. (G-I) Dorsal views, anterior to the left, colour coded MIPs of three developmental stages acquired by in vivo 2-PM after cell ablations close to the ThEPC at 32 hpf in an Et(-1.0otpa:mmGFP)hd1 embryo. The LUT shows the Z colour code table according to the depth of each stack. (G, G') White and blue arrowheads show the bilateral location of ThEPC neurons and the second cluster of projecting neurons respectively. The asterisks mark the ablated area next to the ThEPC neurons. (G') The inset shows the position of ThEPC cells before ablation. (H) Yellow dots and arrows highlight the axonal tips of contralateral projecting ThEPC axons and the red dot and arrow marks the tip of a ThEPC axon projecting ipsilaterally. Green arrowheads show the location of the third cluster of projecting neurons. (I) Habenular network architecture at 5 dpf. The IPN is normally innervated by dHb axons. (J, K, M, N) Dorsal views, anterior to the left, MIP of Et(- 1.0otpa:mmGFP)hd1 embryos after complete unilateral dHb cell ablation. (J, M) Asterisks mark the site of ablation, anterior white arrowheads mark non-ablated dHb cells and posterior arrowheads mark ThEPC neurons. (K, N) White arrowheads mark habenula efferent projections entering the IPN on the non-ablated side. Original stacks were cropped and the gamma was adjusted to 0.80 for display purposes. (L, O) 3D-reconstructions of dHb efferent projections innervating the IPN at 4 dpf from dorsal (top) and lateral (bottom). White arrowheads highlight dHb efferent projections entering (L) the ventral IPN after ldHb cell ablation and (O) the dorsal IPN after rdHb cell ablation. Note the characteristic crown shaped structure of dIPN innervating axons in O. d, dorsal; Hb, habenula; IPN, interpeduncular nucleus; l, left; r, right; Tec, optic tectum; ThEPC, thalamic-epithalamic early projecting cluster; v, ventral. |

ThEPC ablations specifically affect dHb network formation. (A, B, D, E) Dorsal views, anterior to the top, MIPs focussed on (A, B) the habenulae and (D, E) the IPN of 4 dpf embryos. The original stacks were cropped and the gamma adjusted for display purposes. (A-C) The number of HuC/D positive differentiating habenular neurons (non-ablated: n = 9,86 +/- 3,48; ablated: n = 13,14 +/- 5,52; p = 0,32) and their ratio (non-ablated: n = 0,41 +/- 0,16 ; ablated: n = 0,45 +/- 0,14; p = 0,68) between the left and right side is not altered by unilateral ThEPC ablation (n = 7). In addition, also pineal cell development was unaffected (non-ablated: n = 25,12 +/- 3,05; ablated: n = 23,14 +/- 2,54; p = 0,23; n = 7). (D, E) Unilateral ThEPC ablation results in the stalling of dHb efferent axons (asterisks) before reaching the normally formed IPN (encircled) as marked by somatostatin-1 (sst1) expression (red) in Et(-1.0otpa:mmGFP)hd1 embryos. The insets show sst1 expression in the IPN in the red channel. dHb, dorsal habenula; IPN, interpeduncular nucleus; l, left; p, pineal; r, right. |