
- Title
-
Motile-Cilia-Mediated Flow Improves Sensitivity and Temporal Resolution of Olfactory Computations
- Authors
- Reiten, I., Uslu, F.E., Fore, S., Pelgrims, R., Ringers, C., Diaz Verdugo, C., Hoffman, M., Lal, P., Kawakami, K., Pekkan, K., Yaksi, E., Jurisch-Yaksi, N.
- Source
- Full text @ Curr. Biol.
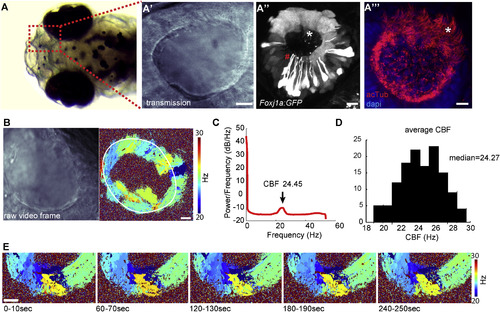
Multiciliated Cells in the Nose Pit of 4-Day-Old Zebrafish Larvae Are Spatially Organized and Beat Their Cilia at a Distinct Frequency (B and C) Fast (100 Hz) transmission microscopy recordings in the nose pit of a representative animal (B, left) showed that the patches of motile cilia beat at frequencies ranging from 20 to 30 Hz (B, right, nose cavity is indicated with a white line), with an average of 24.45 Hz, as shown by power spectral density analysis (C). (D) Average ciliary beating frequency from 130 zebrafish larvae ranges from 19 to 29 Hz, with a median of 24.27 Hz. (E) Beating frequency is stable during 5 min, reported for one representative pit at 1 min intervals. Scale bars represent 10 μm. See also Figures S1 and S2 and Movie S1. EXPRESSION / LABELING:
|
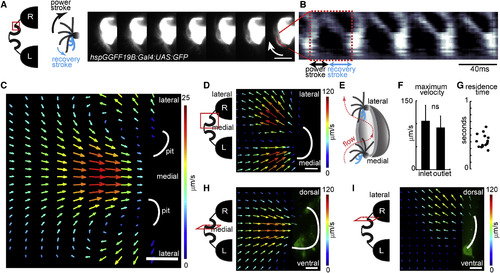
Motile Cilia Beat with an Asymmetric Stroke and Generate Stereotypical Flow Fields around the Nose (A) Beating pattern of two adjacent multiciliated cells, sparsely labeled with GFP (hspGGFF19B;UAS:GFP), recorded by light-sheet microscopy at 900 Hz. Red inlet on the left scheme marks the region of recording around the nose. Montage represents seven images separated by 4.5 ms on the right. Arrow marks the direction of beating. Note the asymmetric curvature of cilia during strokes, as exemplified in the model on the left. (B) Kymogram of pixel intensity along the red line shows an asymmetric beating pattern composed of a fast power stroke and a slow recovery stroke. A complete beating cycle has a period of 40 ms. (C) Flow fields are measured by particle image velocimetry using confocal microscopy images (2.15 Hz) of fluorescent particles around the nose pits (indicated by white lines) of 4-day-old zebrafish larvae. Imaging plane is viewed from dorsal. Warm colors and large arrows indicate strong flow. Direction of the arrows indicate the direction of the flow. Note that the stereotypical flow fields generated by motile cilia attract water from medial regions into the nose pits and eject it toward the lateral directions. (D) Close-up and faster (19.6 Hz) measurements of the dorsally viewed flow fields near the right nose pit. Note high flow rates of inflow (medially) and outflow (laterally) near the nose pits. Red inlet in the scheme on the left depicts the imaged region. (E) Model summarizing the directional orientation of asymmetrically beating motile cilia along the nose pits based on light-sheet microscopy measurements of individual sparsely labeled cilia from 11 animals. Cells located medially beat toward the pit. Cells located laterally beat toward the outside of the pit. (F) Maximal flow velocities at the inlet and outlet of the nose pits are not significantly different (15 nostrils from eight larvae). Error bars indicate the SD. (G) Residence times of particles in the nose pit measured in 15 nostrils from eight larvae, calculated based on inflow, outflow, and the volume of the nose pit. (H and I) Flow fields at the right nose pit laterally viewed at two different depths, (H) medial and (I) lateral, as indicated by red inlets in the left scheme. Foxj1a:GFP larvae were used (n = 4). Note that (H) at the medial plane inflow attracts water from all directions, and (I) at the lateral plane outflow ejects water mostly dorsally. Scale bars represent 10 μm (A), 100 μm (C), and 20 μm (D–I). p value by sign-rank test; ns, non-significant. See also Figure S2 and Movies S2 and S3. EXPRESSION / LABELING:
|
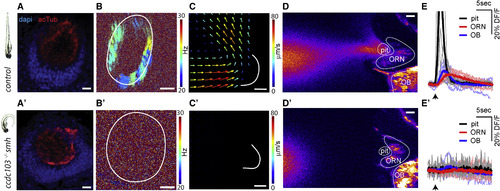
Lack of Ciliary Beating in the Multiciliated Cells of smh−/− Zebrafish Diminishes Flow Fields around the Snout, Hampers Attraction of Odors to Nose Pit, and Consequently Impairs Neural Responses to Odors in Stagnant Environments (A) The smh−/− larvae that are identified by their bend body axis (left) have a normal ciliary distribution in the nose pit, confirmed by acetyl-tubulin staining. (B and C) In the nose pit of smh−/− larvae, (B and B’) no ciliary beating (n = 9 for smh−/−, CBF = none; n = 10 for controls, CBF = 23.9 ± 1.2 Hz) and (C and C’) no flow fields (n = 3 for smh−/− and controls) are detected when compared to control animals. (D and E) Fluorescently labeled food odor is released from a capillary using a microinjector, and odor flow dynamics and neural responses to odors are imaged using two-photon microscopy in HuC:GCamp6s zebrafish expressing transgenic calcium indicators. No external flow is applied. (D and D') Raw video frames following microinjection were averaged. Note that the flow generated by motile cilia can attract odors to the nose pit in control zebrafish (D), whereas smh−/− larvae fail to attract odors (D’). (E and E') Time course of odor dynamics in the nose pit and neural responses to odors in ORNs and the OB in (E) control and (E') smh−/− larvae are represented as percentage change of fluorescence over time (DF/F). Note that in controls the odor is rapidly attracted and ejected from the nose pit (black), which results in transient odor responses in ORNs (red) and the OB (blue). In contrast, smh−/− larvae do not attract odor to the nose pit and thus ORNs and the OB do not display calcium activity. Light lines are individual traces, dark lines are average, and black arrows mark the time of odor injections. n = 7 (wild-type) and n = 6 (smh−/−). All scale bars represent 20 μm. See also Movies S4 and S5.. |
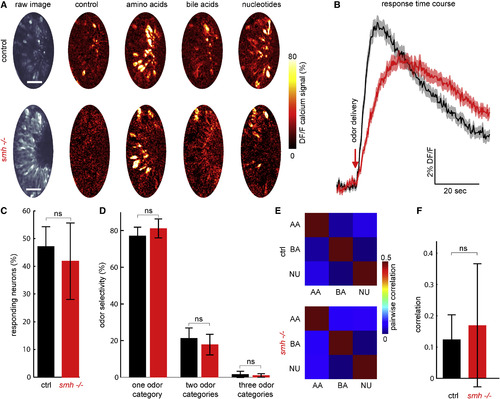
No Significant Differences Were Observed in the Odor Coding of ORNs in smh−/− Zebrafish When Long, 20 s Odor Pulses Are Presented with Constant Flow (A) Control and smh−/− 4-day-old zebrafish larvae expressing HuC:GCamp6s were exposed to three major odor categories: amino acids, bile acids, and nucleotides. Representative images show neural responses in the form of relative change in fluorescent intensity (DF/F) in GCamP6s signals of ORNs in control and smh−/− larvae. Scale bars represent 25 μm. (B) Average responses of all individual ORNs show slower kinetics of response in smh−/− larvae (red) when compared to control (black). (C) The ratio of odor-responding ORNs is not significantly different in smh−/− versus control animals in long odor pulses with constant flow. ORNs are considered odor responding if their calcium responses are 2 SD above the mean activity during baseline. (D) Odor selectivity of responding ORNs to one, two, or three of presented odor categories is not significantly different in smh−/− larvae when compared to control animals. (E and F) Odor category selectivity is further quantified by calculating pairwise correlations of odor representations across hundreds of individual ORNs. (E) Average correlation matrices and (F) comparison of pairwise odor correlations in individual animals suggest no change in odor selectivity in control versus smh−/− larvae. n = 6 (controls) and n = 5 (smh−/−). Error bars indicate the SD (p value by rank-sum test; ns, non-significant). |
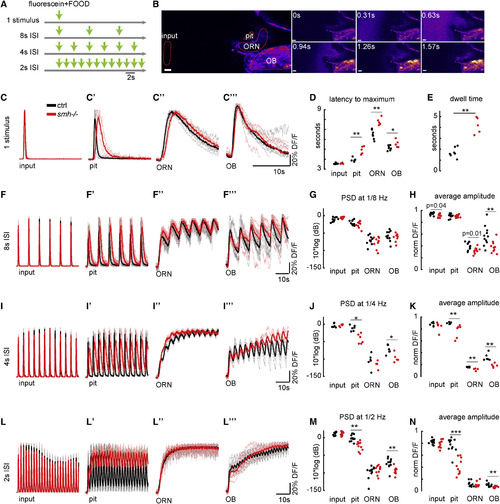
Dynamic Sampling of Odors via Ciliary Beating Increases the Temporal Resolution of the Olfactory System and Enhances the Detection of Fast Changes in Odor Plumes (A) Fluorescently labeled odor pulses of 0.5 s are delivered by a pinch valve at various inter-stimulus intervals (ISIs) in order to generate odor plumes with increasing frequencies. (B) Montage representing the two-photon microscopy images preceding and following the delivery of a single odor pulse. Time is in seconds. (C–N) Odor kinetics at the input (C–L) and the nose pit (C'–L') as well as odor responses in ORNs (C''–L'') and the OB (C'''–L''') are visualized by two-photon microscopy in 4-day-old HuC:Gcamp6 larvae and are quantified by the percentage change in fluorescence intensity of fluorescein or GCamp6 DF/F in these regions normalized to the maximum for each larva. Control zebrafish is in black, and smh−/− zebrafish with no ciliary beating is in red. (C–E) For a single 0.5 s odor pulse, odors reach the nose pit with a significant delay (D) and reside longer (C’ and E) in smh−/− zebrafish. As a result, ORNs and the OB get activated with a delay (C'', C''', and D). (F–N) With decreasing inter-stimulus intervals, while the odor kinetics at the input are similar(F, I, and L), the odor signals in the nose pit (F', I', and L') and odor responses at the level of ORNs (F'', I'', and L'') and OBs (F''', I''', and L''') are slower in smh−/− zebrafish. The temporal resolution of odor detection is quantified by two different approaches: the power spectral density of odor signals (non-normalized DF/F) at the frequency of odor delivery in the nose pit, ORNs, and OBs (G, J, and M) and the average amplitude of oscillations in normalized odor signals, after the first pulse (H, K, and N). Both of these measures confirm that control animals with ciliary beating are significantly better in detecting fast changes in odor dynamic compared to smh−/− zebrafish with no ciliary beating. Scale bars represent 20 μm. p values by rank-sum test (∗∗p < 0.01 and ∗∗∗p < 0.001). See also Movies S6 and S7. PHENOTYPE:
|
Multiciliated cells bearing motile cilia are located at the periphery of the nose pit above the ORNs. Related to Figure 1. Two photon microscopy optical section of the nose pit in Foxj1a:GFP 4 days old larvae at multiple depths from rostral to caudal. Scale bar is 10μm, 2μm spacing between the individual images. Note that the multiciliated cells with motile cilia have a distinct cuboidal shape, which is different from pear shaped ORNs that are also labelled in Foxj1a:GFP larvae. Also note that multiciliated cells are arranged in a semi-circle along the nose pit. |
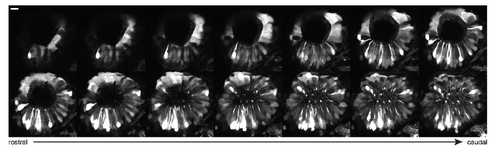
Multiciliated cells in the nose pit of salmon larvae are spatially organized, beat at a distinct frequency and generate a stereotypical flow. Related to Figures 1 and 2. (A) Representative picture of a salmon larvae 4 days post hatching. The nose pit is indicated by a red inlet. (B) Confocal microscopy image of the nose pit, where all cilia are labelled by acetyl tubulin staining (red) and cell nuclei are labelled with DAPI staining (blue). The nose pit is composed of one anterior and one posterior opening connected by one channel. Note the enrichment of acetyl tubulin positive motile cilia at the posterior opening. (C) 100Hz transmission microscopy recordings in the posterior opening of the nose pit (indicated by the inlet on the confocal image) of a representative animal (left) showed that motile cilia beat at frequencies of about 25Hz (right, nose cavity is indicated with a white line). (D) Average ciliary beating frequency from 6 salmon larvae at 2 different locations range from 23.1 to 29.3Hz, with a mean of 26.5 +/-2 Hz. (E-F) Flow fields were calculated by particle image velocimetry in confocal microscopy measurements (19.6 Hz) of fluorescent particles around the nose pits at the inlet (E) and outlet (F). Nose pits are indicated by white lines. Imaging plane viewed from dorsal. Warm colors and large arrows indicate strong flow. Direction of the arrows indicate the direction of the flow. Note that the stereotypical flow fields generated by motile cilia attract water through the inlet to the outlet. Red inlet in the scheme on the top depicts the imaged region. Scale bars are 20μm. |