
- Title
-
A Novel Zebrafish ret Heterozygous Model of Hirschsprung Disease Identifies a Functional Role for mapk10 as a Modifier of Enteric Nervous System Phenotype Severity
- Authors
- Heanue, T.A., Boesmans, W., Bell, D.M., Kawakami, K., Vanden Berghe, P., Pachnis, V.
- Source
- Full text @ PLoS Genet.

Loss of ret leads to dose-dependent reduction of ENS progenitors and neurons. (A-B) WT (ret+/+), rethu2846/+, and rethu2846/2846 larvae immunostained at 4dpf with HuC/D antibody to visualize enteric neurons (A) and processed at 3dpf by RNA in situ hybridization to detect nadl1.2 expressing ENCCs (B). Asterisks indicate end of gut tube (anal pore), filled arrows and arrowheads denote position of last HuC/D+ neuron or nadl1.2+ ENCCs, and open arrows denote gut areas lacking nadl1.2+ ENCCs. (C) Number of HuC/D+ neurons in the distal gut was significantly reduced relative to WT counterparts, at 3dpf (WT: 47±3, rethu2846/+: 29±8, p = 0.0281) and 5dpf (WT: 137±7, rethu2846/+: 70±14, p = 0.0009). However, rethu2846/+ larvae had a phenotypic range: some rethu2846/+ larvae showed neuron numbers equivalent to WT, and other rethu2846/+ larvae showed comparably fewer neurons than WT. Position of the 10th most distal enteric neuron was also significantly altered in rethu2846/+ larvae. Y-axis indicates somite lengths from end of the gut (*) (in rethu2846/+ larvae 4.6±0.8 somite lengths from the end of the gut vs. 2.3±0.3 in WT, p = 0.012). Again, rethu2846/+ larvae display a phenotypic range. EXPRESSION / LABELING:
PHENOTYPE:
|

rethu2846/+ larvae exhibit ENS progenitor migration deficits. ENS progenitor migration at the front of migration (wavefront) visualized in real time by virtue of the SAGFF234A;UAS:GFP background labeling ENCCs. (A) Representative still images from confocal time-lapse recordings (depth-coded to resolve 2 migratory streams) of WT (ret+/+) and rethu2846/+ embryos at 0 minutes (48hpf) and 500 minutes (56hpf), show that distance travelled by the migration wavefront is decreased in rethu2846/+ larvae relative to WT larvae. Asterisk denotes a GFP+ cell from outside the ENS linage that remains in the same position. (B) The calculated wavefront migration speed (microns/minute) is significantly reduced in rethu2846/+ larvae relative to WT at 48–56hpf (p = 0.0022), and 72–80hpf (p = 0.0182). |
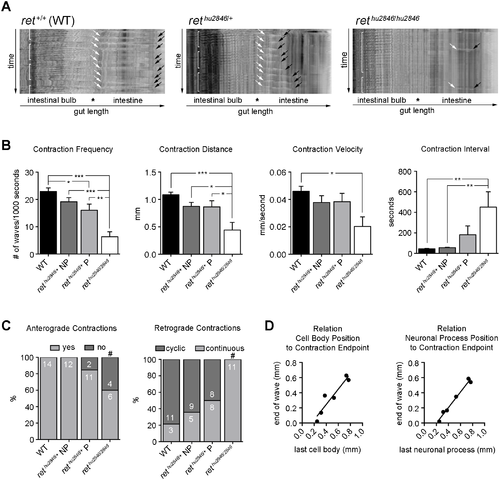
Intestinal motility is impaired in rethu2846/+ and rethu2846/2846 larvae. (A) Spatiotemporal maps (STMs) generated to quantify 400 second recordings of gut motility in live 7dpf zebrafish larvae. WT (ret+/+) larvae exhibit cyclical retrograde (anal to oral) motility patterns in the intestinal bulb (brackets), and anterograde (oral to anal) peristaltic waves in the intestine starting at the intestinal bulb/intestine junction (white arrows); black arrows denote motility end points. STMs of rethu2846/+ larvae with ENS phenotypes and rethu2846/2846 larvae show alterations in cyclical retrograde motility patterns (brackets) and frequency and distance of anterograde motility waves (white to black arrows). (B) Anterograde contraction characterization. Phenotypic (rethu2846/+P) and non-phenotypic (rethu2846/+NP) larvae identified immunohistochemically. Reduced peristaltic frequency in rethu2846/2846 larvae and rethu2846/+ P relative to WT (one-way ANOVA, p = 0.0004; Bonferroni’s post-hoc, p = 0.0001 and p = 0.0367), and also reduced in rethu2846/2846 larvae as compared to rethu2846/+ NP (p = 0.0002) and rethu2846/+ P (p = 0.0035). Reduced contraction travel distance in rethu2846/2846 larvae relative to WT (one-way ANOVA, p = 0.0005; Bonferroni’s post-hoc, p = 0.0002), and relative to both rethu2846/+ P (p = 0.0232) and rethu2846/+ NP (p = 0.0237). Reduced contraction velocity in rethu2846/2846 relative to WT (one-way ANOVA, p = 0.0212; Bonferroni’s post-hoc, p = 0.0138). Increased contractions interval in rethu2846/2846 larvae relative to WT and rethu2846/+ NP (one-way ANOVA, p = 0.0078; Bonferroni’s post-hoc, p = 0.0053 and p = 0.0097). (C) Loss of anterograde contractions in rethu2846/hu2846 larvae compared to WT and rethu2846/+ NP (#, Fisher’s exact, p = 0.0198 and p = 0.028). rethu2846/2846 larvae show retrograde motility changes relative to all other genotypes, with contractions losing cyclic patterns (Fisher’s exact, vs. WT: p = 0.0001, vs. rethu2846/+ NP: p = 0.001, and vs. rethu2846/+ P: p = 0.0082). (D) Equivalent analysis in the SAGFF234A;UAS:GFP background, expressing GFP in ENS cells and their processes, enables mapping of contraction endpoints relative to cell body position (GFP+HuC/D+ cells, rs = 0.8857, p = 0.0333) and cell process (GFP+HuC/D+ process, rs = 0.942, p = 0.0167). Black lines indicate linear fits. PHENOTYPE:
|
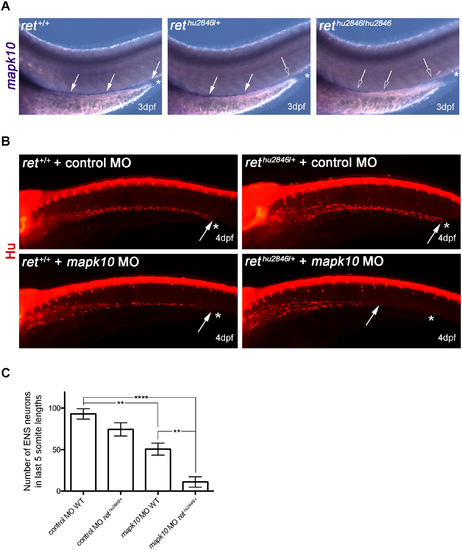
Using rethu2846/+ as sensitized background to test role of mapk10 as ENS development modifier gene. (A) RNA in situ hybridization shows mapk10 expression correlates with location of the ENS in WT (ret+/+), rethu2846/+, and rethu2846/hu2846 3dpf larvae (asterisks indicate end of gut, filled arrows indicate mapk10+ cells, and open arrows denote gut areas lacking mapk10+ cells). (B) MO gene knock-down of mapk10 (using a splice blocking MO, mapk10MO) performed on embryos from WT x rethu2846/+ cross to allow knock-down in both WT and rethu2846/+ embryos, and compared to a control MO. Immunostaining with HuC/D at 4dpf shows that most severe phenotypes are observed when mapk10MO is injected into rethu2846/+ embryos. Asterisks indicate end of gut tube (anal pore), and arrows denote position of last HuC/D+ neuron. (C) Quantification of neuron number in the last 5 somite lengths shows that injection of mapk10MO into WT embryos causes a modest, statistically significant reduction of enteric neurons in the gut relative to WT larvae injected with control MO (one-way ANOVA, p<0.001; Bonferroni’s post-hoc test, p = 0.0033), revealing a role for mapk10 in normal ENS development. Injection of mapk10MO into rethu2846/+ embryos causes severe reduction of enteric neurons, which is statistically different from either rethu2846/+ injected with control MO (one-way ANOVA, p<0.001, Bonferroni’s post-hoc test, P<0.0001) or mapk10MO injected into WT embryos (one-way ANOVA p<0.001, Bonferroni’s post-hoc test p = 0.006). EXPRESSION / LABELING:
PHENOTYPE:
|

ZFIN is incorporating published figure images and captions as part of an ongoing project. Figures from some publications have not yet been curated, or are not available for display because of copyright restrictions. PHENOTYPE:
|

rethu2846/+ larvae exhibit phenotypic variation. 7dpf larvae immunostained with the HuC/D antibody to visualize ENS neurons in WT (A) and rethu2846/+ (B-D) larvae. Asterisks indicate end of the gut tube (anal pore), and arrows denote the position of the most distal HuC/D+ neuron. At 7dpf, WT (ret+/+) larvae exhibit HuC/D+ ENS neurons along the full length of the gut (A). Some rethu2846/+ larvae also show full colonization of the gut by HuC/D+ ENS neurons (B), and are referred to as ‘non-phenotypic’ or rethu2846/+ NP. Other rethu2846/+ larvae show varying extents of distal regions lacking HuC/D+ ENS neurons (C, D), and are referred to as ‘phenotypic’ or rethu2846/+ P. High-resolution images of full gut length was constructed by tiling two overlapping micrographs. |
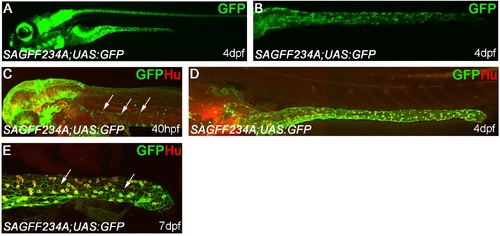
Novel transgenic tools allow labeling of ENS progenitors and ENS neurons. SAGFF234A is a transgenic line with the Gal4 expressing gene trap construct integrated within the chrm2a gene on the chromosome 4 encoding the cholinergic receptor, muscarinic 2a. When crossed to transgenic fish carrying the GFP reporter gene downstream of the Gal4 recognition sequence (UAS:GFP) generates transgenic embryos expressing GFP within the ENS at 4dpf (A, B), in both ENS progenitors at 40hpf (C, arrows) and in virtually all HuC/D+ ENS neurons at 4dpf (D). (E) At 7dpf GFP can be detected in cellular processes of HuC/D+ ENS neurons, distal intestine shown (cellular processes of ENS neurons indicated with arrows). The high-resolution image of the full gut length (in D) was constructed by tiling two overlapping micrographs. |

Proliferation, cell death and differentiation are all unaffected in rethu2846/+ larvae. (A-C) Proliferation of ENS progenitor cells is equivalent in 48hpf WT (A) and rethu2846/+ (B) larvae, shown using GFP from SAGFF234A;UAS:GFP to label pixel area of ENS progenitors and BrdU (following 30 minute BrdU pulse) to quantify proliferating cells per 220um (1000 pixels) of the distal migratory wavefront of progenitors (p = 0.9182) (C). The area (in pixels squared) (D) and roundness (4*area/(π*major axis2)) (E) of the migratory wavefront was quantified, and significant increases in both parameters reflect the fact that the rethu2846/+ embryo wavefront is not elongated as is seen in WT (p<0.0001 for both area and roundness). (F-I) TUNEL staining on 42hpf WT (F,G) and rethu2846/+ (H,I) larvae does not show any TUNEL+ apoptotic cells (red, G,I) within the GFP+ migratory stream of ENCCs (F,H). (J-M) Differentiation was assayed in the SAGFF234A;UAS:GFP line by comparing HuC/D expression with GFP expression in 4dpf larvae (J,K) and counting differentiated serotonergic cells (5-HT+) within 5dpf larvae (L,M). While HuC/D+ cells show expected significantly decreased numbers in rethu2846/+ larvae (J, L, p = 0.0096 and p = 0.0045, respectively), the percentage of progenitor cells (GFP+Hu-) cells is not significantly altered (K, p = 0.3785), and the percentage of 5-HT+ cells is also not significantly altered (M, p = 0.2188). |

mapk10 is expressed within the SAGFF234A;UAS:GFP expressing ENS lineage. RNA in situ hybridization for mapk10 was conducted in SAGFF234A;UAS:GFP embryos at 54 (A) and 72hpf (D). Immunostaining for GFP identifies the stream of migrating ENCCs (B, both streams shown, E, one stream shown). Merged images indicate that cells containing map10 signal localize to the GFP+ population (C, F arrows denote a number of these cells). |
|
Unillustrated author statements PHENOTYPE:
|