
- Title
-
Cyp26 Enzymes Facilitate Second Heart Field Progenitor Addition and Maintenance of Ventricular Integrity
- Authors
- Rydeen, A.B., Waxman, J.S.
- Source
- Full text @ PLoS Biol.

Cyp26-deficient embryos fail to add ventricular cardiomyocytes. (A–F) Control (Ctrl) and Cyp26-deficient Tg(myl7:DsRed2-NLS) embryo hearts at 36 (A,D), 48 (B,E), and 72 hpf (C,F). Ventricles are red only (brackets) and atria are green (AMHC immunostaining). (G) Graph indicating cardiomyocyte counts at 36 (n = 10 for control and n = 8 for Cyp26 deficient), 48 (n = 15 per group) and 72 hpf (n = 15 per group). (H) Graph indicating fold difference of mRNA relative to β-actin assayed with RT-qPCR for the cardiac differentiation markers myl7, vmhc, and amhc. (I,J) Confocal images of hearts from Tg(myl7:Kaede) embryos at 48 hpf that were photoconverted at 36 hpf. Brackets indicate ventricular addition (green only cells) to the hearts. Arrows denote cardiomyocytes outside of the heart tube. (K) Graph depicting quantification of the amount of ventricular addition to the OFT (n = 8 per group). Frontal views, anterior up (A–F); n > 20 embryos per group (A-F,I,J). Error bars are standard error of the mean (SEM), asterisks denote p < 0.05 compared to controls by Student’s t test. Scale bar: 50 μm. EXPRESSION / LABELING:
PHENOTYPE:
|
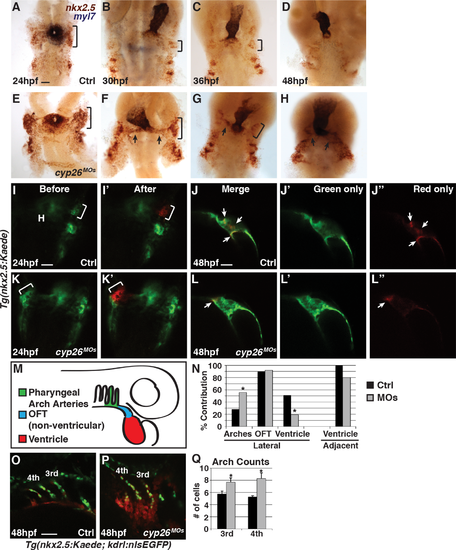
SHF progenitors do not add to the heart tube in Cyp26-deficient embryos. (A–H) ISH of control and Cyp26-deficient Tg(nkx2.5:ZsYellow) embryos at 24 (A,E), 30 (B,F), 36 (C,G), and 48 (D,H) hpf. Nkx2.5:zsyellow (red) and myl7 (purple). (A–C,E–G) Brackets indicate nkx2.5:ZsYellow+ cells in the first nkx2.5+ pharyngeal arch. (F,G) Arrows indicate accumulation of nkx2.5+ cells adjacent to the arterial pole of the heart. (I,I’,K,K’) Tg(nkx2.5:Kaede) before and after photoconversion of the anterior lateral population of nkx2.5+ cells (bracket) in control and Cyp26-deficient embryos at 24 hpf. (J–J”,L–L”) Position of photoconverted cells (red, arrows) relative to the heart tube (green) in control and Cyp26-deficient embryos at 48 hpf. Images in I–J” and K–L”, respectively, are of the same control and Cyp26-deficient embryos. (M) Schematic depicting the three regions where photoconverted nkx2.5:Kaede+ cells contributed at 48 hpf. (N) Graph depicting percentage of contribution to the third and fourth PAAs, non-ventricular OFT, and ventricular cardiomyocytes (control-lateral n = 39, control-adjacent n = 8, Cyp26-deficient–lateral n = 52, Cyp26-deficient–adjacent n = 5). (O,P) Confocal images of arch arteries in Tg(nkx2.5:Kaede; kdrl:nlsEGFP) control and Cyp26-deficient embryos. (Q) Graph depicting quantification of the endothelial cell number in the third and fourth PAAs in control (n = 18) and Cyp26-deficient (n = 24) embryos. Ventral view, anterior up (A–H); dorsal view, anterior up (I,I’,K,K’); lateral view, anterior up (J,J’,J”,L,L’,L”); lateral view, anterior right (O,P). n > 20 per group for (A–H). Asterisk denote p < 0.05 by Chi Squared test. H, heart. Scale bar: 50 μm. |
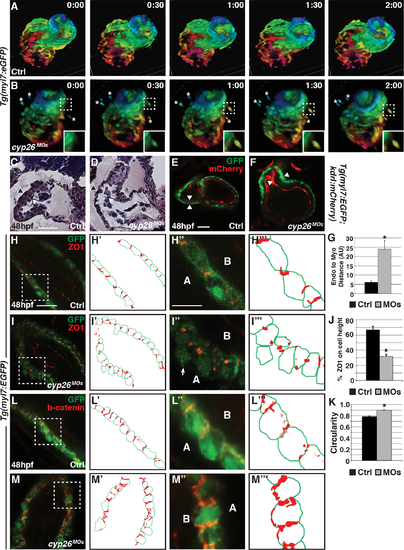
Ventricular cardiomyocytes can exit the heart tube in Cyp26-deficient embryos. (A,B) 30-min interval frames from confocal time-lapse movies of control and Cyp26-deficient Tg(myl7:EGFP) hearts. Images of hearts were depth-coded with the spectrum ranging from pink at 120 μm to blue at 0 μm. (C,D) Hematoxylin–eosin (HE) stained frontal sections of the hearts from control and Cyp26-deficient embryos. Endocardium (white arrowheads) and myocardium (black arrowheads). Control hearts n = 4. Cyp26-deficient hearts n = 5. (E,F) Control and Cyp26-deficient Tg(myl7:EGFP);Tg(kdrl:mCherry) embryos at 48 hpf. Endocardium (red) and myocardium (green). Arrowheads indicate the inner border of endocardial and outer border of myocardial cells. (G) Graph showing the distance between the endocardial and myocardial layers (control n = 5, Cyp26 deficient n = 7). (H–I”‘) Confocal images of control and Cyp26-deficient Tg(myl7:EGFP) hearts stained for zonula occludens 1 (ZO1) (red) and green fluorescent protein (GFP) (green), with schematized outlines of cell boundaries and ZO1 staining. Arrow denotes cardiomyocyte protruding into the pericardial space. (J) Graph depicting the percentage of ZO1 expression along the height of cardiomyocytes (control n = 15, Cyp26 deficient n = 15). (K) Graph depicting circularity measurement of ventricular cells (control n = 15, Cyp26 deficient n = 30). (L–M''') Confocal images of control and Cyp26-deficient Tg(myl7:EGFP) hearts stained for β-catenin (red) and GFP (green), with schematized outlines of cell boundaries and β-catenin staining. Error bars are SEM, asterisk denotes p < 0.05 by Student’s t test. Frontal views, anterior up (A–F,H,I,L,M); n > 20 embryos per group (E,F,H,I,L,M). A, apical; B, basal. Scale bar for C–M’: 50 μm. Scale bar for H''–M''': 25 μm. EXPRESSION / LABELING:
PHENOTYPE:
|
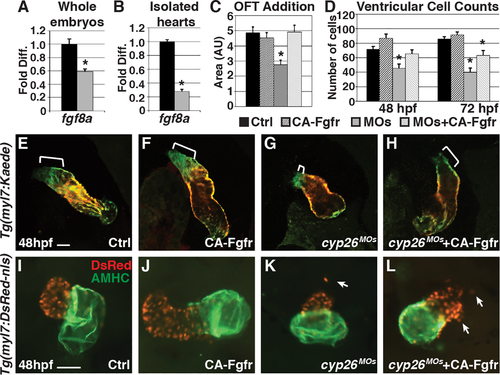
Restoring FGF signaling rescues SHF addition but not ventricular integrity. (A,B) Graphs indicating fold difference of mRNA relative to β-actin assayed with RT-qPCR of fgf8a expression in whole embryos and isolated hearts at 48 hpf. (C) Graph depicting quantification of ventricular addition to the OFT (control n = 8, CA-Fgfr n = 6, Cyp26 deficient n = 10, Cyp26 deficient+CA-Fgfr n = 6). (D) Graph of ventricular cardiomyocyte counts at 48 and 72 hpf (n = 10 per group). (E–H) Confocal images of optical slices from hearts of Tg(myl7:Kaede) and Tg(myl7:Kaede);Tg(hsp70:ca-fgfr1) embryos at 48 hpf after heat-shock at 24 hpf and photoconversion at 36 hpf. Brackets indicate added ventricular cells (green only). (I–L) IHC for hearts from Tg(myl7:DsRed-NLS) and Tg(myl7:DsRed-NLS);Tg(hsp70:ca-fgfr1) at 48 hpf after heat-shock at 24 hpf. Arrows indicate ectopic cardiomyocytes. Error bars are SEM, asterisk denotes p < 0.05 by Student’s t test. Frontal views with anterior up (E–L); n > 20 embryos per group (E–L). Scale bar: 50 μm. EXPRESSION / LABELING:
PHENOTYPE:
|
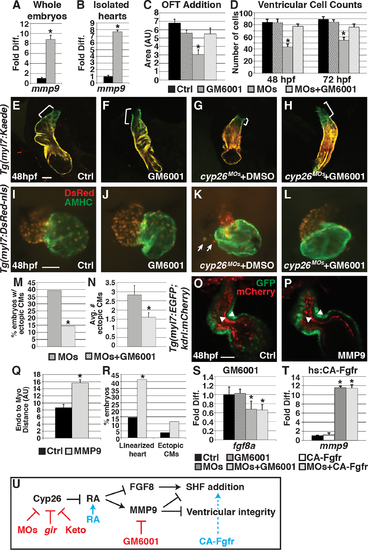
Attenuating MMP function restores SHF addition and ventricular integrity. (A,B) Graphs indicating fold difference of mRNA relative to β-actin assayed with RT-qPCR of mmp9 expression in whole embryos and isolated hearts at 48 hpf. (C) Graph showing quantification of ventricular addition to the OFT (control n = 11, GM6001 treated n = 11, Cyp26 deficient n = 12, Cyp26 deficient + GM6001 n = 12). (D) Graph depicting ventricular cardiomyocyte counts at 48 and 72 hpf (n = 10 per group). (E–H) Confocal images of optical slices from hearts of Tg(myl7:Kaede) embryos at 48 hpf after photoconversion at 36 hpf. Brackets indicate ventricular addition (green only). (I–L) IHC of hearts from control and Cyp26-deficient Tg(myl7:DsRed-NLS) embryos after DMSO or GM6001 treatment. Arrows indicate ectopic cardiomyocytes. (M) Graph depicting the percentage of embryos with ectopic cardiomyocytes in Cyp26 deficient treated with DMSO or GM6001 at 48 hpf. (N) Graph depicting average number of ectopic cardiomyocytes (per embryo with ectopic cardiomyocytes) at 48 hpf. (O,P) Confocal images of optical slices through control (lineage tracer alone) or activated MMP9-injected Tg(myl7:EGFP);Tg(kdrl:mCherry) hearts at 48 hpf. Arrowheads denote the inner border of endocardial and outer border of myocardial cells. (Q) Graph depicting the quantification of the distance between the endocardium and myocardium (control n = 12, MMP9 injected n = 10). (R) Graph depicting the percentage of embryos with linearized, dysmoprhic hearts and cells outside the heart (n > 50 per group). (S) Graph indicating fold difference of mRNA relative to β-actin assayed with RT-qPCR of fgf8a expression at 48 hpf in control and Cyp26-deficient embryos treated with DMSO or GM6001. (T) Graph indicating fold difference of mRNA relative to β-actin assayed with RT-qPCR of mmp9 expression at 48 hpf after heat-shock induction of CA-Fgfr1. (U) Model of Cyp26 enzyme function in the ventricular OFT development. Red indicates reagents used to inhibit function. Blue indicates reagents used to activate function. Controls in C–E, I, and S were DMSO treated. Controls in O, Q, R indicate Cascade blue-dextran injected alone. Error bars are SEM, asterisks denote p < 0.05 compared to controls by Student’s t test (A–D,N,Q–T), asterisk denotes p<0.05 by Chi Squared test (M). Frontal views, anterior up (E–L,M,N); n > 20 embryos per group (E–L,M,N). CMs, cardiomyocytes. Scale bar: 50 μm. EXPRESSION / LABELING:
PHENOTYPE:
|

Cyp26-deficient embryos have increased RA signaling. (A-B') ISH for gfp in WT and Cyp26-deficient Tg(β-actin:VPBD-RLBD;UAS:EGFP) embryos. Arrows in A’ and B’ indicate expression in the heart. (C-F) ISH for cyp26a1 in WT and Cyp26-deficient embryos at 32 and 48 hpf. Arrows in C’ and C’ indicate increased expression in the cardiac region. (A,B,C,D,E,F) Lateral view, anterior left, (A’,B’,C’,D’) Dorsal view, anterior up; n>20 embryos (A-F). Scale bars: 50 mm. |
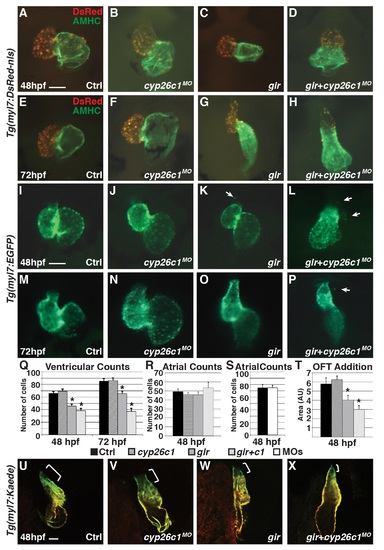
Gir mutants and gir+c1 embryos fail to add ventricular cardiomyocytes and have ectopic cardiomyocytes. (A-H) IHC of hearts from control, Cyp26c1-depleted, gir mutant, and gir+c1 Tg(myl7:DsRed-NLS) embryos at 48 and 72 hpf. (I-P) Hearts from control, Cyp26c1-depleted, gir mutant, and gir+c1 Tg(myl7:EGFP) embryos at 48 and 72 hpf. Arrows denote ectopic cardiomyocytes. Ectopic cardiomyocytes were observed in 0/74 control, 1/80 Cyp26c1-depleted, 8/29 gir, and 7/31 gir+c1 at 48 hpf. (Q) Graph depicting ventricular cardiomyocyte counts at 48 and 72 hpf (n = 10 per group). (R) Graph depicting atrial cardiomyocyte counts at 48 hpf (n = 10 per group). (S) Graph depicting atrial cardiomyocyte counts at 48 hpf (n = 10 per group) in control and Cyp26-deficient embryos. (T) Graph of ventricular addition to the OFT (n = 10 per group). (U-X) Control, cyp26c1 MO injected, gir, and gir+c1 Tg(myl7:Kaede) embryo hearts at 48 hpf after photoconversion at 36 hpf. Brackets indicate ventricular addition (green only). Error bars are SEM, asterisks denote p<0.05 compared to controls by Student’s t-test. All images are frontal views with anterior up; n>20 embryos for (U-X). Scale bars: 50 mm. |

Pharmacologically enhancing RA levels can recapitulate Cyp26-deficient heart defects, while inhibiting RA production and co-injecting cyp26a1 mRNA can restore Cyp26-deficient heart defects. (A,B) IHC of DMSO or Ketoconazole (Keto) treated embryos at 48 hpf with ventricle in red (MHC) and atrium in green (AMHC). (C) Graph depicting ventricular counts of DMSO or Ketoconazole treated embryos at 48 hpf. (D,E) Hearts of Tg(myl7:EGFP) embryos at 72 hpf that were treated with DMSO or 2 μM RA beginning at 24 hpf. Arrows denote ectopic cardiomyocytes. (F) Graph of ventricular counts embryos at 48 and 72 hpf (n = 10 per group) of DMSO or 2 μM RA treatment beginning at 24 hpf. (G-J) Hearts at 48 hpf in control or Cyp26-deficient Tg(myl7:EGFP) embryos treated with DMSO or DEAB. (K) Graph depicting ventricular cell counts at 48 hpf for DMSO, DEAB, Cyp26-deficient + DMSO, and Cyp26-deficient + DEAB treated embryos. (L) Graph depicting ventricular cell counts at 48 hpf in control and Cyp26-deficient Tg(myl7:DsRed-NLS) embryos injected with cyp26a1 mRNA. (M-P) Hearts at 48 hpf from control, cyp26a1 mRNA-injected, Cyp26-deficient and Cyp26-deficient injected with cyp26a1 mRNA Tg(myl7:EGFP) embryos. Error bars are SEM, asterisks denote p<0.05 by Student’s t-test. All images are frontal views with anterior up; n>20 embryos for (A,B,D,E,G-J,M-P). Scale bars: 50 mm. |

SHF-derived bulbous arteriosus does not form in Cyp26-deficient embryos. (A-D) ISH for elnb in control, Cyp26c1-depleted, gir mutant, and gir+c1 embryos. (E-H) ISH for elnb in control and Cyp26-deficient embryos after heat-shock induction of FGF. (I-L) ISH for elnb in control or Cyp26-deficient embryos treated with DMSO or GM6001.Control embryo in I were treated with DMSO. Lateral view, anterior up (A-L). Scale bar: 50 mm. |

SHF progenitors are specified in Cyp26-deficient embryos. (A-F) ISH of mef2cb at 16 somites (s), 24, and 30 hpf in control and Cyp26-deficient embryos. (G,H) ISH of ltbp3 at 30 hpf in control and Cyp26-deficient embryos. Arrows in C-H indicate expression in the OFT. (I) RT-qPCR for mef2cb at 16 s, 24, 36 and 48 hpf. (J) RT-qPCR for ltbp3 at 16 s, 24, 36 and 48 hpf. (K) RT-qPCR for nkx2.5 at 16 s, 24, 36 and 48 hpf. (L) Graph depicting total number of nkx2.5+ cells at 24 hpf (n = 11 for control, n = 14 for Cyp26-deficient). (M) Graph depicting the percentage of proliferating nkx2.5+ cells at 24 hpf (n = 11 for control, n = 14 for Cyp26-deficient). (N) RT-qPCR for tbx1 at 16 s, 24, 36, and 48 hpf. For RT-qPCR, fold difference of mRNA was calculated relative to β-actin. (O-R) ISH for tbx1 at 24 and 30 hpf in control and Cyp26-deficient embryos. Arrows indicate tbx1 staining adjacent to the heart. Error bars are SEM, asterisks denote p<0.05 by Student’s t-test. Dorsal view, anterior up (A-D), lateral view anterior right (E-H); n>20 embryos per group for (A-H). Scale bars: 50 mm. |

Ectopic cardiomyocytes in Cyp26-deficient embryos undergo apoptosis. (A,B) IHC of control or Cyp26-deficient Tg(myl7:EGFP) embryos for aCasp3 (red) and GFP (green). Arrows denote ectopic cardiomyocytes co-expressing aCasp3. 16/18 ectopic cardiomyocytes were co-labeled. Asterisk denotes aCasp3+ cell potentially within the heart tube. Frontal view, anterior up; Control n = 30. Cyp26-deficient n = 11 embryos. Scale bar: 50 mm. |

Gir mutants and gir+c1 embryos have disrupted polarity and cell shape. (A-D) Confocal images of IHC of control, Cyp26c1-depleted, gir mutant, and gir+c1 Tg(myl7:EGFP) stained for ZO1 (red), and GFP (green). (A’-D’) Schematized outlines of cell boundaries and ZO1 staining for images in A-D. Arrows denotes cardiomyocytes protruding into the pericardial space. (E) Graph depicting the percentage of ZO1 expression along the height of cardiomyocytes (n = 36 for each group). (F) Graph depicting circularity measurement of ventricular cells (n = 36 for each group). Error bars are SEM, asterisks denote p<0.05 by Student’s t-test. Lateral views, anterior right (A-D). A, apical; B, basal. Scale bar: 50 mm. |

Restoring FGF signaling does not restore ventricular integrity. (A) Graph depicting percentage of embryos with ectopic cardiomyocytes (Cyp26-deficient n = 49, Cyp26-deficient Tg(hsp70:ca-fgfr1) n = 41). (B) Graph depicting average number of ectopic cardiomyocytes in embryos with ectopic cardiomyocytes (Cyp26-deficient n = 14, Cyp26-deficient Tg(hsp70:ca-fgfr1) n = 9). (C) Graph depicting ventricular cell counts at 72 hpf of Tg(hsp70:ca-fgfr1) after a second heatshock at 48hpf. Error bars are SEM, asterisks denote p<0.05 by Student’s t-test. |

Increased mmp9 expression in Cyp26-deficient embryos is not due to an increase in macrophage and neutrophil numbers. (A,B) ISH of mmp9 in control and Cyp26-deficient embryos at 48 hpf. (C) RT-qPCR of mmp9 expression in control, Cyp26c1-depleted, gir mutant, and gir+c1 embryos. (D,E) ISH of mfap4 in control and Cyp26-deficient embryos at 48 hpf. (F) Graph depicting quantification of average macrophage number over the yolk sac (n = 15 per group). (G,H) ISH of mpx in control and Cyp26-deficient at 48 hpf. (I) Graph depicting the average number of neutrophils over the yolk sac (n = 10 per group). Error bars are SEM. Lateral view, anterior left (A,B), frontal view, anterior up (D,E,G,H); n>20 embryos per group (A,B,D,E,G,H). Scale bars: 50 mm. |
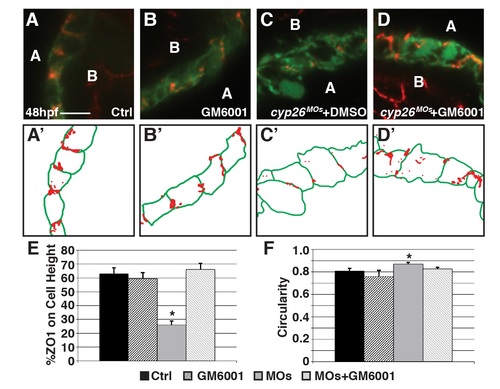
GM6001 treatment restore ventricular cardiomyocyte polarity and shape in Cyp26-deficient embryos. (A-D) Confocal images of IHC of control (DMSO treated), GM6001 treated, Cyp26-deficient DMSO treated, Cyp26-deficient GM6001 treated Tg(myl7:EGFP) embryos stained for ZO1 (red) and GFP (green). (A’-D’) Schematized outlines of cell boundaries and ZO1 staining for images in A-D. (E) Graph depicting the percentage of ZO1 expression along the height of cardiomyocytes. (F) Graph depicting circularity measurement of ventricular cells. For E and F, control n = 18, GM6001 treated n = 15, Cyp26-deficient n = 21, Cyp26-deficient + GM6001 treated n = 21. Error bars are SEM, asterisks denote p<0.05 by Student’s t-test compared to controls. Lateral views, anterior right (A-D). A, apical; B, basal. Scale bars: 25 mm. |