
- Title
-
Wdr68 Mediates Dorsal and Ventral Patterning Events for Craniofacial Development
- Authors
- Alvarado, E., Yousefelahiyeh, M., Alvarado, G., Shang, R., Whitman, T., Martinez, A., Yu, Y., Pham, A., Bhandari, A., Wang, B., Nissen, R.M.
- Source
- Full text @ PLoS One

Wdr68 is required for craniofacial development between the 17 somites and prim-5 stages. A) Ventral view of 5dpf alcian blue stained cartilages in wild type zebrafish. M: Meckel’s PQ: Palatoquadrate. B) Mild mutant phenotype resulting from rearing of embryos at 24°C, characterized by joint fusions (arrowhead) between M and PQ. C) Severe mutant phenotype resulting from rearing of embryos at 32°C, characterized by the loss of M and PQ. D) Immunohistochemistry readily detects maternal Wdr68 protein up to the 17 somites stage in wdr68hi3812/hi3812 mutants raised at the permissive 24°C temperature (blue line). Maternal Wdr68 is lost by the 17 somites stage in wdr68hi3812/hi3812 mutants raised at the non-permissive 32°C temperature (red line). E) wdr68-MO injected non-transgenic (Non-Tg) animals display jaw defects regardless of heat shock. wdr68-MO injected Tg(hsp70l:GFP-Wdr68)csu9 animals that are heat shocked by the prim-5 stage show rescue from jaw defects. Error bars indicate standard deviation. Additional abbreviations: Shield (Sh), 15 somites (15s), 17 somites (17s), 20 somites (20s), 25 somites (25s), prim-5 (p5), prim-25 (p25), no heat shock (-HS). |

Edn1 functions downstream of wdr68 for craniofacial development. (A-D) Ventral views of 5dpf Alcian stained craniofacial cartilages of zebrafish raised at 32°C. A) wildtype sibling injected with EF1a mRNA. B) wdr68 mutant injected with EF1a mRNA. C) wdr68hi3812/hi3812 mutant injected with Edn1 mRNA. D) wdr68hi3812/hi3812 mutant injected with Flag-Wdr68 (FW) mRNA. E) Edn1 mRNA-injected mutants have more M cartilage elements than EF1a controls (p<0.001). (F-Q) ISH analysis of dlx6a expression in embryos raised at 32°C with red arrowhead pointing at 1st arch CNCC territory. F, H, J, L) dorsal view of prim-5 stage. G, I, K, M) lateral view of prim-5 stage. F, G) wildtype sibling injected with GFP/dsRed (G/R) plasmid mix showing normal dlx6a expression. H, I) wdr68hi3812/hi3812 mutant injected with G/R plasmid mix showing loss of dlx6a in 1st arch CNCC. J, K) wildtype sibling injected with GFP/Edn1 (G/Edn1) plasmid mix showing near-normal dlx6a expression. L, M) wdr68hi3812/hi3812 mutant injected with G/Edn1 plasmid mix showing partial rescue of dlx6a in 1st arch CNCC. N-Q) lateral view of dlx6a expression in prim-5 stage embryos raised at 28.5°C. N) heat shocked wildtype sibling control with normal dlx6a. O) heat shocked wildtype sibling injected with Et1-MO showing loss of dlx6a. P) heat shock induced Tg(hsp70l:GFP-Wdr68) sibling control with normal dlx6a. Q) heat shock induced Tg(hsp70l:GFP-Wdr68) sibling injected with Et1-MO showing loss of dlx6a. |
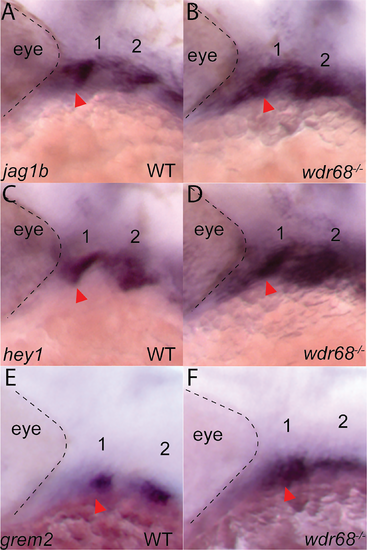
Wdr68 restricts expression of jag1b, hey1, and grem2 from ventral territory. ISH analysis on embryos raised at 32°C. A) normal expression of jag1b in dorsal territory at the prim-25 stage, B) expansion of jag1b into ventral territory in wdr68hi3812/hi3812 mutants, C) normal expression of hey1 in dorsal territory at the prim-25 stage, D) expansion of hey1 into ventral territory in wdr68hi3812/hi3812 mutants, E) normal expression of grem2 in dorsal territory at the prim-25 stage, F) expansion of grem2 into ventral territory in wdr68hi3812/hi3812 mutants. |

DM treatment induces loss of M cartilage and edn1 expression in wdr68hi3812/hi3812 zebrafish. (A-D) Ventral views of 5dpf Alcian stained craniofacial cartilages of zebrafish raised at 24°C and treated with DMSO or 10μM DM at 14–15 somites stage. A) Wildtype embryo treated with DMSO control. B) wdr68hi3812/hi3812 mutant treated with DMSO show joint fusions between M and PQ. C) Wildtype embryo treated with DM reveal no defects in craniofacial cartilages. D) wdr68hi3812/hi3812 mutants treated with DM show severe reduction in PQ and deletion of M. E) DM-treated mutants show significantly more severe defects compared to the control group (p<0.040). (F-I) Dorsal views of edn1 ISH analysis on 20 somites stage embryos treated with DMSO or 10μM DM starting at the 14–15 somites stage. F) Wildtype embryos treated with DMSO control. G) wdr68hi3812/hi3812 mutants treated with DMSO control show reduced edn1 expression. H) Wildtype embryos treated with DM show mildly reduced edn1 expression. I) wdr68hi3812/hi3812 mutants treated with DM lack edn1 expression. EXPRESSION / LABELING:
PHENOTYPE:
|

ISL treatment partially rescues M cartilage and edn1 expression in wdr68hi3812/hi3812 zebrafish. (A-D) Flatmounts of 5dpf ventral cartilages of Alcian stained zebrafish raised at 32°C and treated with DMSO or 5μM ISL starting at the 14- to 15-somites stage. A) Wildtype zebrafish treated with DMSO control. Red arrow indicate M. B) wdr68hi3812/hi3812 mutants treated with DMSO control show a lack of M cartilage. C) Wildtype zebrafish treated with 5μM ISL show normal craniofacial cartilage formation. D) wdr68hi3812/hi3812 mutants treated with 5μM ISL show a partial rescue of M. E) Fraction of mutant embryos with partial M is significantly greater in the ISL treated group (p<0.006). (F-I) Dorsal views of edn1 ISH analysis on 20-somites stage embryos treated with DMSO or 5μM ISL starting at the 14- to 15-somites stage. F) Wildtype embryos treated with DMSO control. G) wdr68hi3812/hi3812 mutants treated with DMSO control show lack of edn1 expression. H) Wildtype embryos treated with ISL show similar expression compared to wild type. I) wdr68hi3812/hi3812 mutants treated with ISL are indistinguishable from that of wildtype. EXPRESSION / LABELING:
PHENOTYPE:
|

TGF-β interference with BMP signaling is enhanced in cells lacking Wdr68 expression. A) Isolation of Wdr68/Dcaf7 knock-out C2C12 cell sublines and expression levels in growth medium (GM) versus differentiation medium (Diff). Panel A1) Lanes 1 and 4, Wdr68 protein was detected in the control NT1 cells. Lanes 2 and 5, Δwdr68-5 lacks wildtype Wdr68 protein expression. Lanes 3 and 6, Δwdr68-9 lacks wildtype Wdr68 protein expression. Panel A2) β-tubulin expression was used as a loading control and did not differ substantially between lanes. Panel A3) pYap1 levels did not differ substantially between lanes. Panel A4) Total Yap1 levels did not differ substantially between lanes. B) pSmad1/5 induction was not substantially altered in Δwdr68-5 or Δwdr68-9 sublines. Panel B1) pSmad1/5 levels in control (NT1) or Δwdr68-5 (5) cells after 1 hour of exposure to 0, 1, 10, or 100ng/mL BMP4 in DM. Panel B2) β-tubulin expression was used as a loading control and did not differ substantially between lanes. Panel B3) pSmad1/5 levels in control (NT1) or Δwdr68-9 (5) cells after 1 hour of exposure to 0, 1, 10, or 100ng/mL BMP4 in DM. Panel B4) β-tubulin expression was used as a loading control and did not differ substantially between lanes. C) Transient transfection of NT1, Δwdr68-5, and Δwdr68-9 sublines with BRE-Luc and SV40-Renilla plasmids and induced with 0, 1, 10, or 100ng/mL BMP4 in GM. No significant differences were found between control and deletion sublines. Representative experiment shown from at least 3 independent trials. D) Transient transfection of NT1, Δwdr68-5, and Δwdr68-9 sublines with BRE-Luc and SV40-Renilla plasmids, induced with 10ng/mL BMP4, and then challenged with 0, 0.1, 1.0, or 10ng/mL TGF-®1. At 10ng/mL TGF-®1 interference with BRE-Luc activity was significantly greater in the Δwdr68-5 and Δwdr68-9 sublines relative to NT1 controls (* = p < 0.002). Representative experiment shown from at least 3 independent trials. E-H) Immunofluorescence detection of pSmad1/5 in prim-12 stage zebrafish embryos raised at 32°C. E) wildtype sibling embryo. F) wdr68hi3812/hi3812 mutant embryo. G) DMSO-treated wildtype sibling. H) ISL-treated wildtype sibling. |
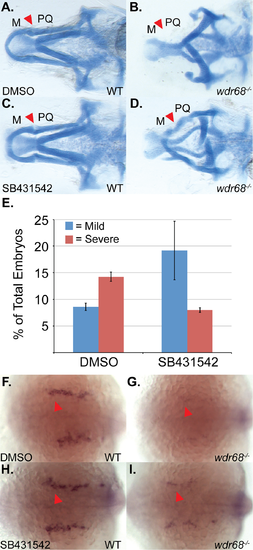
Inhibition of TGF-β signaling partially rescues M cartilage and edn1 expression in wdr68hi3812/hi3812 zebrafish. (A-D) Ventral views of 5dpf Alcian stained craniofacial cartilages of zebrafish raised at 32°C and treated with DMSO or 10μM SB431542 at 14- to 15-somites stage. A) Wildtype zebrafish treated with DMSO control. Red arrow indicates M-PQ joint region. B) wdr68hi3812/hi3812 mutants treated with DMSO control show a lack of M cartilage. C) Wildtype zebrafish treated with 10μM SB431542 show normal craniofacial cartilage formation. D) wdr68hi3812/hi3812 mutants treated with 10μM SB431542 show a partial rescue of M. E) SB431542-treated mutants show a significantly reduced fraction of severe defects compared to the control group (p<0.012). (F-I) Dorsal views of edn1 ISH analysis on 22-somites stage embryos treated with DMSO or 10μM SB431542 starting at the 14- to 15-somites stage. F) Wildtype embryos treated with DMSO control. G) wdr68hi3812/hi3812 mutants treated with DMSO control show lack of edn1 expression. H) Wildtype embryos treated with SB431542 show similar expression compared to wild type. I) wdr68hi3812/hi3812 mutants treated with SB431542 show partial restoration of edn1 expression. EXPRESSION / LABELING:
PHENOTYPE:
|

dlx1a and dlx2a expression is wdr68-dependent and responsive to inhibition of TGF-β signaling in wdr68hi3812/hi3812 zebrafish. (A-H) ISH analysis of prim-12 stage embryos raised at 32°C. A-F) dlx2a expression with red underline for anterior portion of 1st arch and blue underline for 2nd arch. A, C, E) lateral view. B, D, F) dorso-lateral view. A, B) DMSO-treated wildtype sibling showing normal dlx2a. C, D) DMSO-treated wdr68hi3812/hi3812 mutant showing loss of anterior 1st arch dlx2a. E, F) SB431542-treated wdr68hi3812/hi3812 mutant showing partial rescue of anterior 1st arch dlx2a. G, H) dlx1a expression. G) wildtype sibling showing normal dlx1a. H) wdr68hi3812/hi3812 mutant showing loss of anterior 1st arch dlx1a. |
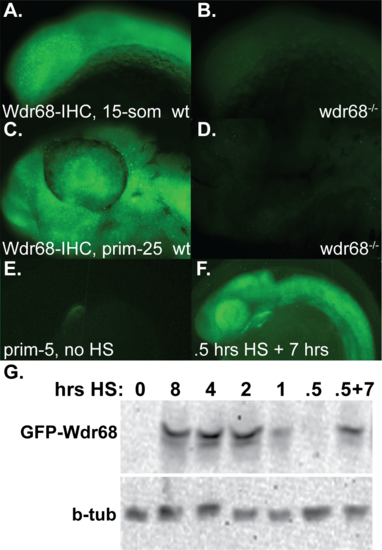
Detection of endogenous Wdr68 and ectopic GFP-Wdr68 fusion protein in zebrafish embryos. A-D) Immunofluorescence detection of endogenous Wdr68. A) Wdr68 expression in a wildtype 15-somites stage embryo raised at 32°C. B) a wdr68 mutant lacking Wdr68 protein. C) Wdr68 expression in a wildtype prim-5 stage embryo raised at 32°C. D) a wdr68 mutant lacking Wdr68 protein. E-F) live imaging of GFP fluorescence in Tg(hsp70l:GFP-wdr68)csu9 animals. E) transgenic animal with the only detected GFP expression coming from the cmlc:eGFP marker for transgenesis. F) same animal as in E but after a 0.5 hour heat shock (HS) at 39°C followed by 7 hours of recovery at 28.5°C. G) western blot analysis of Tg(hsp70l:GFP-wdr68)csu9 animals after various lengths of heat shock exposure. Panel G1) GFP-wdr68 expression is induced by heat shock. Panel G2) β-tubulin expression was used as a loading control and did not differ substantially between lanes. EXPRESSION / LABELING:
PHENOTYPE:
|

Phenotypes and distributions observed in ectopic GFP-Wdr68 fusion protein expressing embryos and control siblings. A-F) ventral views of 5dpf alcian blue stained cartilages from embryos raised at 28.5°C. A) heat shocked wildtype sibling displaying normal cartilages. B) heat shock induced Tg(hsp70l:GFP-wdr68) overexpression yielded no discernible cartilage phenotype. C) wdr68-MO injected animal showing the mild M-PQ joint fusion phenotype. D) wdr68-MO injected animal showing the severe loss of M and PQ phenotype. E) wdr68-MO injected heat shock induced Tg(hsp70l:GFP-wdr68) animal showing rescued normal M and PQ cartilages. F) wdr68-MO injected heat shock induced Tg(hsp70l:GFP-wdr68) animal showing rescued mild M-PQ joint fusions. G) plot of the distribution of phenotypes observed in a representative experiment on wdr68-MO injected Tg(hsp70l:GFP-wdr68) animals. |
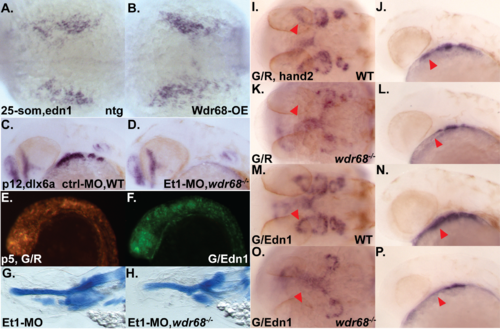
Epistatic analysis of wdr68 and edn1. A-B) ISH analysis for edn1 expression on 25-somites stage animals raised at 28.5C that were heat shocked at the bud and 20-somites stages. A) wildtype sibling with normal edn1 expression. B) Tg(hsp70l:GFP-wdr68) embryo overexpressing GFP-Wdr68 with near-normal edn1 expression. C-D) ISH analysis on prim-12 stage embryos. C) wildtype control sibling with normal dlx6a expression. D) Et1-MO;wdr68hi3812/hi3812 mutant lacking dlx6a expression in all arches. E-F) merged green-red channel fluorescence on prim-5 stage embryos injected with either GFP/dsRed (G/R) or GFP/Edn1 (G/Edn1) plasmid mixtures. E) broad GFP/dsRed expression in a G/R embryo. F) broad GFP expression in a G/Edn1 embryo. G-H) lateral view of 5dpf alcian blue stained embryo. G) Et1-MO injected animal showing loss of M and CH but retention of PQ. H) Et1-MO;wdr68hi3812/hi3812 mutant showing loss of M, CH, and PQ. I-P) ISH analysis for hand2 expression on prim-12 stage animals raised at 32°C. Red arrowhead points at 1st arch expression of hand2. I, K, M, O) dorsal view. J, L, N, P) lateral view. I, J) wildtype sibling injected with G/R mix showing normal hand2. K, L) wdr68hi3812/hi3812 mutant injected with G/R mix showing loss of 1st arch hand2. M, N) wildtype sibling injected with G/Edn1 mix showing normal hand2. O,P) wdr68hi3812/hi3812 mutant injected with G/Edn1 mix showing loss of 1st arch hand2. |

BMP4, C2C12 deletions, and ISL controls. A) ISH analysis of prim-25 stage wildtype and wdr68 mutant animals revealed no differences in expression of bmp4. B) C2C12 wildtype and deletion subline sequences at the targeted locus in exon-5. The yellow highlight indicates the guide RNA target sequence followed by the TGG PAM sequence. C and D) ISH analysis for hand2 expression. C) ISL-treated wildtype sibling. D) ISL-treated mutant sibling lacking rescue. E and F) ISH analysis for dlx2 expression. E) ISL-treated wildtype sibling. F) ISL-treated mutant sibling lacking rescue. |
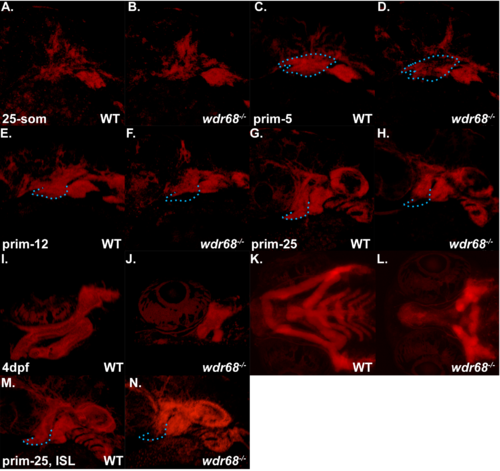
Live confocal analysis of Tg(sox10:mCherryCAAX);wdr68hi3812/hi3812 mutants and wildtype siblings. A-N) Confocal images of the pharyngeal arch regions of embryos live-mounted in 0.7% agarose containing 0.0167% Tricaine. A) 25-somites stage wildtype sibling. B) 25-somites stage wdr68hi3812/hi3812 mutant. C) prim-5 stage wildtype sibling with 1st arch region outlined in blue. D) prim-5 stage wdr68hi3812/hi3812 mutant with same outline as in C to indicate regions of reduced mCherryCAAX signal. E) prim-12 stage wildtype sibling with ventral 1st arch region outlined in blue. F) prim-12 stage wdr68hi3812/hi3812 mutant with same outline as in E to indicate reduced ventral mCherryCAAX signal. G) prim-25 stage wildtype sibling with ventral 1st arch region outlined in blue. H) prim-25 stage wdr68hi3812/hi3812 mutant with same outline as in G to indicate reduced ventral mCherryCAAX signal. I) lateral view of 4-dpf wildtype sibling cartilages. J) lateral view of 4-dpf wdr68hi3812/hi3812 mutant severely reduced M and PQ cartilages. K) ventral view of animal in I. L) ventral view of animal in J. M) ISL-treated prim-25 stage wildtype sibling with ventral 1st arch region outlined in blue. N) ISL-treated prim-25 stage wdr68hi3812/hi3812 mutant with same outline as in M, H, G to indicate modest rescue of ventral 1st arch mCherryCAAX signal. |