
- Title
-
The Sec domain protein Scfd1 facilitates trafficking of ECM components during chondrogenesis
- Authors
- Hou, N., Yang, Y., Scott, I.C., Lou, X.
- Source
- Full text @ Dev. Biol.

Gene trapping construct and GFP expression pattern of gene trap line RP24-104 during embryogenesis. (A) Schematic of RP-T gene trapping construct. RP-T transposon system composed of two protein-trap cassettes with a transcriptional stop in the opposite direction. Tol2L and Tol2R, tol2 transponase inverted terminal repeat; SA, splice acceptor; GFP, AUG-less monomeric GFP sequence; poly(A)+, polyadenylation signal; terminator, transcriptional border element. (B–L) GFP expression pattern in zebrafish gene trap line RP24-104. Prior to 16-somite stage, GFP signal could be observed in the whole embryo (B to D). From 16-somite stage, elevated signal could be observed in notochord on the ubiquitous GFP expression background (E). As development proceeded, the GFP signal was gradually constrained to the pharyngeal region and cartilage tissue (H, I, J, K and L). From 96 hpf, apparent signal could be observed in the gastrointestinal organs (K) and serotonergic neuroepithelial cells on the skin (L). B and C, lateral view with animal pole to the top. D and E, lateral view with anterior to the top. F-I and K, lateral views with head to left. J and L, ventral views with anterior to the top.
Construct:
Gt(LOXP-GFP,LOXP:GFP)
|
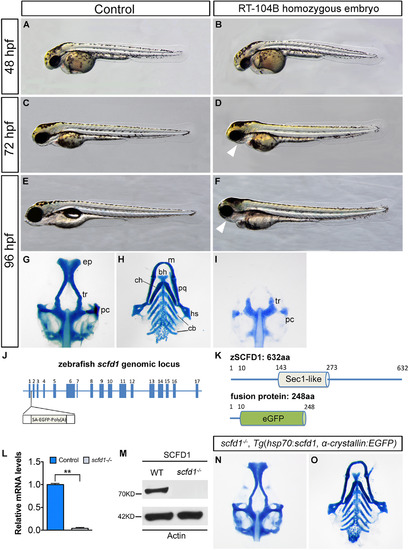
Loss of scfd1 disrupts craniofacial skeletal development. (A–F) Live images of wild type (control) and RP24-104B homozygous embryos at indicated developmental stages. Lateral view with head to left. (G–I, N and O) Alcian blue staining of cartilage elements in head skeleton in ventral views. White arrowheads indicate dismorphic jaw. bh, basihyal; cb, ceratobranchial; ch, ceratohyal; ep, ethmoid plate; hs, hyosymplectic; m, Meckel′s cartilage; pc, parachordal plate; pq, palatoquadrate; tr, trabeculae. (J) The zebrafish scfd1 genomic locus. The transposon is inserted after the first exon. (K) Schematic representations of the domain structure of the wild type zebrafish SCFD1 protein and fusion protein in the gene trap scfd1 mutant. (L and M) Q-PCR and western blotting experiments confirmed loss of scfd1 expression in homozygous mutant embryos at 48 hpf. **P<0.01 as determined by Student's t-tests. Error bars indicate s.e.m. (N and O) Rescue of the scfd1 mutant phenotype in Tg(hsp70:scfd1; α-crystallin:EGFP) embryos at 96 hpf. Heat shock was performed every 12 h from 24 hpf onwards. |
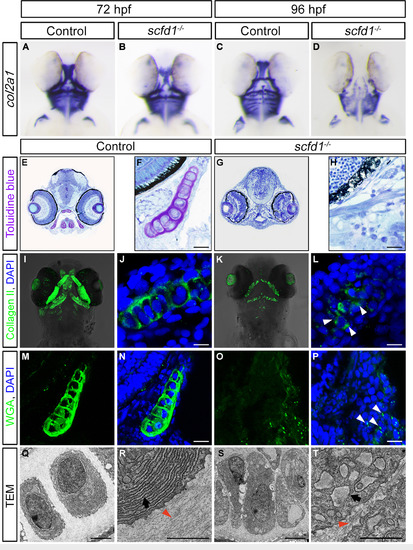
Protein trafficking is disrupted in scfd1 mutants. (A–D) Chondrocytes in scfd1 mutant embryo express col2a1a normally at 72 hpf, with reduced expression by 96 hpf. A to D, ventral views with anterior to the top. (E-H) Toluidine blue staining of transverse sections of the jaw at 80 hpf. Nuclei are stained blue, whereas ECM is stained purple. (I–P) Immunostaining of Collagen II and WGA in the palatoquadrate of 80 hpf wild type and scfd1 mutant embryos. Arrowheads in L and P indicate aberrant intracellular ECM protein localization in a scfd1 mutant. (Q–T) TEM images of 80 hpf wild type and scfd1 mutant chondrocytes. Black arrows indicate well-stacked ER in wild type cell (R) or distended ER membranes in scfd1 mutant cells (T). Orange arrowheads point to collagen fibril deposition in the extracellular space. Scale bars: 25 µm (F, H, J, L, N and P); 2 µm (Q–T). For A to P, at least 15 embryos for each genotype were analyzed and representative samples are shown. For Q to T, 6 embryos for each genotype were analyzed and representative samples are shown. EXPRESSION / LABELING:
PHENOTYPE:
|

The UPR is activated in scfd1 mutant embryos coincident with up-regulated cell death. (A, B, D, E, G, H, J, K, M, N, P and Q) Whole mount in situ hybridization of 72 hpf wild type and scfd1 mutant embryos using probes against ditt3, hspa5, atf5, trib3, edem1 and syvn1. Lateral views with anterior to the left. (C, F, I, L, O and R) Q-PCR experiments confirmed up-regulation of UPR-associated genes in scfd1 mutants. Error bars represent mean±SEM. (S) Elevated xbp1 mRNA splicing was detected by RT-PCR and Q-PCR. xbp1-u, unspliced xbp1 mRNA. xbp1-s, spliced xbp1 mRNA. β-actin was as a loading control for RT PCR. Percentage of spliced xbp1 mRNA determined by the percentage of spliced/total mRNA. Error bars indicate s.e.m. n.s., not significant. **P<0.01 and *P<0.05 as determined by Student's t-tests (C, F, I, L, O and R). (T–X) Enhanced cell death in scfd1 mutants. Ventral view with anterior to the top. (V, W and X) Quantification of TUNEL-positive cells counted on a 0.016 mm2 field (dashed line square). 8 sections for each genotype were analyzed and representative samples are shown. Error bars indicate s.e.m. **P<0.01 as determined by Student's t-tests. Scale bars: 25 µm. |
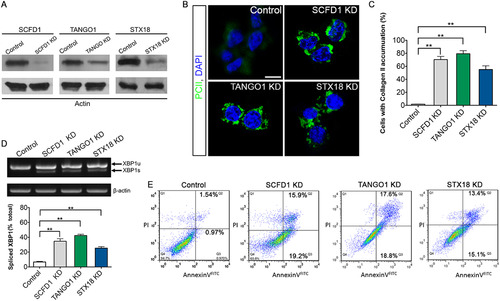
SCFD1 and STX18 are necessary for Procollagen II transport. (A) Efficiency of knockdown of SCFD1, TANGO1 and STX18 as measured by western blotting. (B) Quantification of cells that accumulate Procollagen II intracellularly. The percentage of cells that accumulate Procollagen II intracellularly was determined by counting at least 30 cells in five random fields. The number of cells accumulating Procollagen II in the case of SCFD1, TANGO1 and STX18 shRNA was significantly elevated as compared to control shRNA cells. Error bars indicate s.e.m. **P<0.01 as determined by Student's t-tests. (C) ATDC5 cells were visualized with anti-Collagen II antibody and DAPI. Scale bar, 20 µm. (D) Elevated XBP1 mRNA splicing in ATCD5 cell was detected by RT-PCR and Q-PCR. XBP1-u, unspliced XBP1 mRNA. XBP1-s, spliced XBP1 mRNA. β-actin served as a loading control. Error bars represent mean±SEM. **P<0.01 as determined by Student's t-tests. (E) Apoptosis in ATDC5 cells detected by FACS analysis. The right quadrants (Q2 and Q3) represent apoptotic cells, with cytoplasmic membrane integrity. The average apoptotic rates of control, SCFD1 knockdown, TANGO1 knockdown and STX18 knockdown samples were 2.51±0.56, 35.11±0.40, 36.43±1.31 and 28.58±2.32%, respectively. |

GFP expression pattern of gene trap line RP24-104 in larvae and adult fish. (A-C) At 7 dpf, GFP signal could be observed in pharyngeal arches, liver and intestine. L, liver. (D-F) At 14 dpf, GFP signal could be observed in pharyngeal arches, cranial neuromasts and intestine. (G-M) At adult stage, GFP signal could be observed in lens (G), brain (H), ovary (I), fin osteoblast (J), liver (K), gallbladder (L) and intestine (M). Scale bars in G, H, I, J, K, L and M, 200 um. |
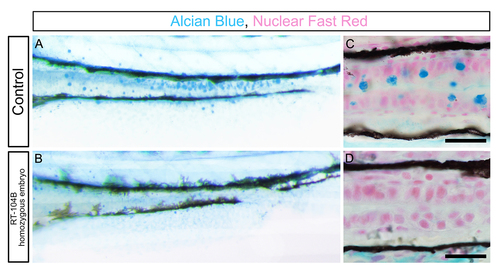
Intestine goblet cells are absent in RT-104B homozygous larvae. (A and B) Alcian blue staining of the intestine of control and RT-104B homozygous larvae at 96 hpf. (C and D) Longitudinal sections of the mid-distal intestinal junction from control and RT-104B homozygous larvae, stained with Alcian blue and nuclear fast red. Alcian-bluestained goblet cells were observed in the mid intestine of control embryos and absent in RT-104B homozygous larvae. Scale bar: 50 um. For A to D, at least 15 larvae for each genotype were analyzed and representative samples are shown. PHENOTYPE:
|
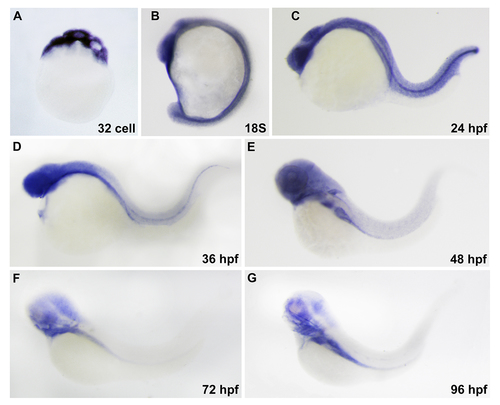
Expression pattern of scfd1 during zebrafish embryogenesis revealed by whole mount RNA in situ hybridization. (A) Maternal deposition of scfd1 mRNA could be detected. (B-D) At 18-somite stage, scfd 1 is expressed in head and notochord. At 24 and 36 hpf, scfd 1 transcript is apparent in head, myotome and notochord. (E-G) From 48 hpf, scfd 1 expression progressively resolved to pharyngeal arches and endodermderived organs. Lateral views with anterior to the top (A and B) or left (C to G). |

ZFIN is incorporating published figure images and captions as part of an ongoing project. Figures from some publications have not yet been curated, or are not available for display because of copyright restrictions. EXPRESSION / LABELING:
|
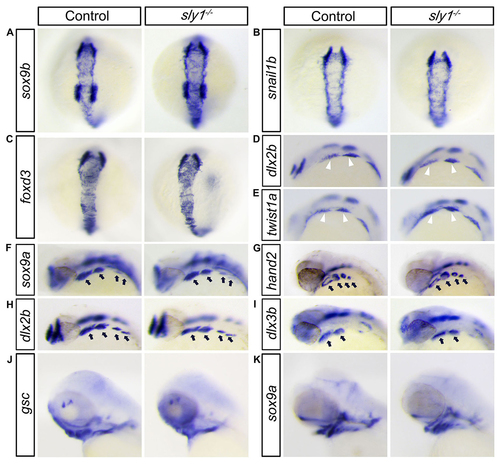
In scfd1 mutant embryos, development of chondrogenic neural crest cell appears normal until initiation of chondrogenesis. (A-C) Sox9b, foxd3, and snail1b are expressed in pre-migratory neural crest at the dorsal side of neural tube at 14 hpf. No overt differences in expression were evident via RNA in situ hybridization between control and mutant embryos, indicating that neural crest cells were properly specified in scfd1 mutant embryos. (D-E) RNA in situ hybridization showed that markers of migratory facial neural crest (white arrowhead), dlx2a and twist1a, were expressed normally in mutants at 18-somite stage (18 hpf). D and E, lateral view with anterior to the top. (F-I) RNA in situ hybridization showed that sox9a, hand2, dlx2b and dlx3b, a group of gene controlling pharyngeal arch (black arrows) patterning and outgrowth, were expressed normally in scfd1 mutants at 32 hpf. D to K, dorsal views with anterior to the top. (J-K) The expression patterns of goosecoid and sox9a, regulators of mesenchymal condensation and chondrocyte differentiation, were unaffected in scfd1 mutants until 72 hpf, indicating that chondrogenesis is initiated normally in scfd1 mutants. L and K, lateral views with anterior to the left. |
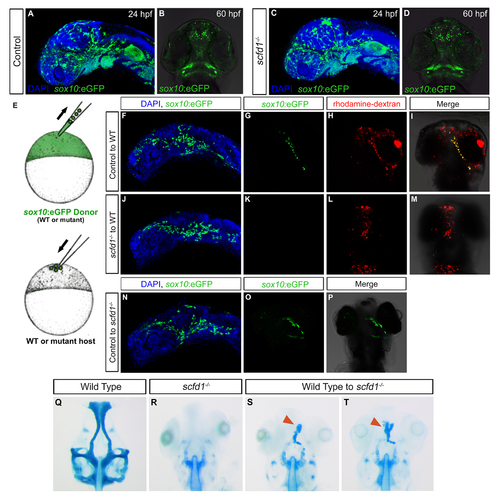
Cell autonomous requirement for scfd1 in neural crest cells for cartilage differentiation. (A-D) Sox10: eGFP transgene expression in control and scfd1 mutant embryo. A and C, lateral views with anterior to left. B and D, ventral views with anterior to the top. (E) Schematic diagram of the transplantation approach. At 4 hpf, cells from a donor (wild type or mutant) Sox10:eGFP transgenic embryo are transplanted to the animal pole of a wild type or scfd1 mutant host embryo. (F, J and N) At 24 hpf, donorderived neural crest cell migration to the oral ectoderm is evident regardless of donor genotype. Lateral views with anterior to the top. (G-I) At 72hpf, in control transplantation experiments, donor cells were observed contributing to cartilage. (J-M) Conversely, in none of the transplants where scfd1 mutant donor cells were used was contribution to cartilage noted. (N-P) We also observed that wild type donor GFP-positive neural crest cells in scfd1 mutant host embryos formed cartilage. (Q-T) At 72 hpf, cartilage staining reveals wild type donor-derived cells partially rescuing anterior neurocranium defects in scfd1 mutant embryos. Red arrowheads indicate cartilage derived from wild type donor cells. |
Reprinted from Developmental Biology, 421(1), Hou, N., Yang, Y., Scott, I.C., Lou, X., The Sec domain protein Scfd1 facilitates trafficking of ECM components during chondrogenesis, 8-15, Copyright (2017) with permission from Elsevier. Full text @ Dev. Biol.