
- Title
-
Deletion of Pr130 Interrupts Cardiac Development in Zebrafish
- Authors
- Yang, J., Li, Z., Gan, X., Zhai, G., Gao, J., Xiong, C., Qiu, X., Wang, X., Yin, Z., Zheng, F.
- Source
- Full text @ Int. J. Mol. Sci.

ZFIN is incorporating published figure images and captions as part of an ongoing project. Figures from some publications have not yet been curated, or are not available for display because of copyright restrictions. EXPRESSION / LABELING:
|
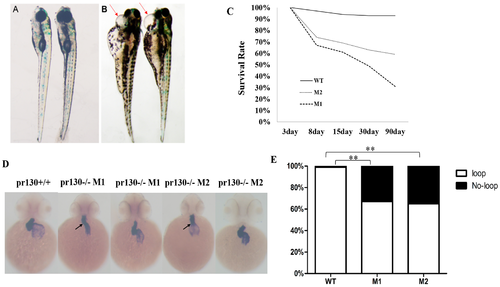
Effects of pr130 deletion on mortality and cardiac development. (A,B) pr130-/- embryos develop pericardial edema (arrow). A, WT; B, pr130-/-; (C) Survival curves; (D) Whole-mount in situ hybridization (WISH) using the heart probe cmlc2. Mutants showed a higher proportion of no-looping (arrows) compared with WT which showed normal heart looping; (E) Percentage of abnormal and normal heart looping. n = 100 embryos analyzed per panel. The symbols ** in the bar chart represent significant differences (p < 0.01). |
|
ZFIN is incorporating published figure images and captions as part of an ongoing project. Figures from some publications have not yet been curated, or are not available for display because of copyright restrictions. PHENOTYPE:
|
|
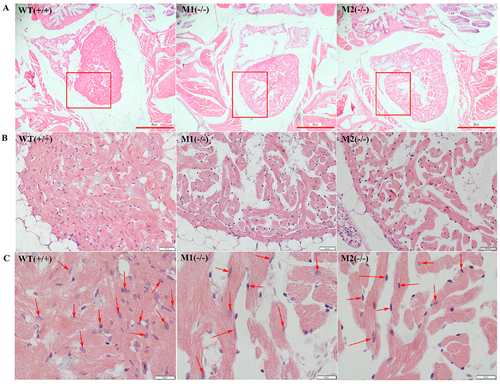
Decreased cardiomyocytes in pr130-/- zebrafish. (A) Representative images of H&E staining of adult heart tissue at 40× magnification. Scale bars, 200 µm; (B) Higher magnification of the boxed regions (400× magnification). The heart tissues of WT, M1, and M2 were from the same region of heart. Scale bars, 20 µm; (C) Pr130-/- exhibited reduced cardiomyocytes. Red arrows indicate the myocardium nucleus. Scale bars, 10 µm; (D) The cardiomyocytes in heart tissues of controls and pr130-/- adult zebrafish were quantified and presented in the bar graph. We calculated the number of cardiomyocytes in each of four chosen fields per fish at a magnification of 1000×. n = 16 hearts analyzed per panel. Data represent the mean ± SD. *, p < 0.05. 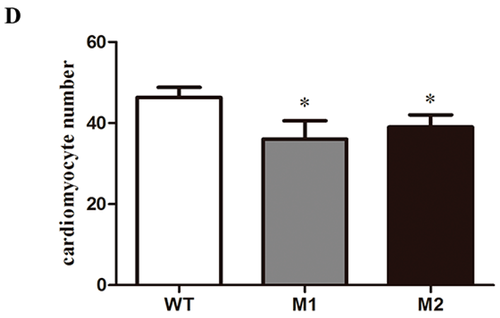
PHENOTYPE:
|
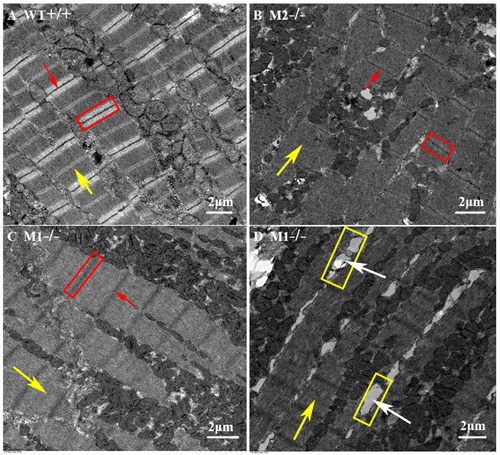
Ultrastructure of adult heart tissues observed using transmission electron microscopy. Pr130-/- zebrafish displayed disordered myocardium. In pr130-/- heart, the boundary of bright band (red boxes), M line (yellow arrows), and Z line (red arrows) were not clear. In some cases the gaps between some longitudinal myocardial fibers increased (yellow boxes and white arrows). PHENOTYPE:
|
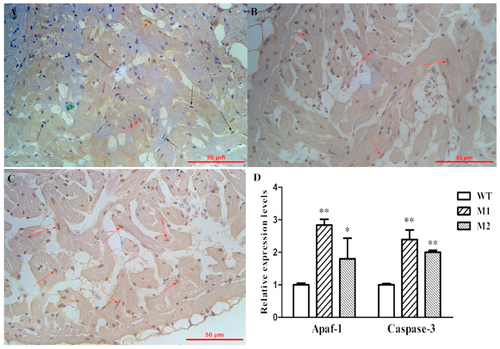
Increased apoptosis was observed in pr130-/-. (A–C) Representative images of Tunel staining sections of adult heart tissue of WT (A), M1 (B), and M2 (C). Black arrows indicate normal cells (blue), red arrows indicate apoptosis cells (brown); (D) Expression levels of apoptosis-associated genes from adult heart tissues. Data represent the mean ± SD. The symbols * and ** in the bar chart represent significant differences (p < 0.05 or p < 0.01). PHENOTYPE:
|