
- Title
-
Effects of NDRG1 family proteins on photoreceptor outer segment morphology in zebrafish
- Authors
- Takita, S., Wada, Y., Kawamura, S.
- Source
- Full text @ Sci. Rep.
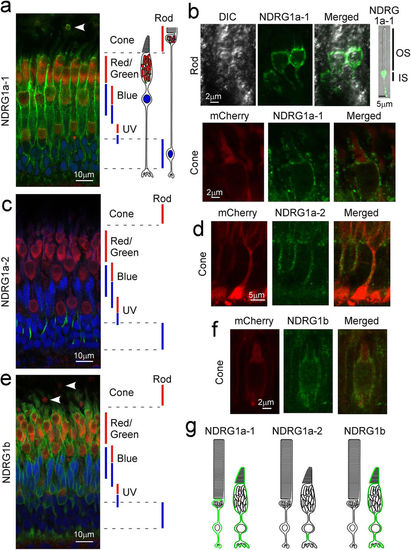
Subcellular localization of NDRG1 family proteins in zebrafish photoreceptors. Adult zebrafish retinas were immunostained with specific anti-NDRG1a-1 (a,b), anti-NDRG1a-2 (c,d) or anti-NDRG1b (e,f) antiserum (all with green signals). Mitochondria and nucleus were counterstained with anti-Tom20 antibody (red signals) and Hoechst 33342 (blue signals), respectively (a,c,e). In a, c and e, approximate positions of ellipsoid containing mitochondria (red bars) and nucleus (blue bars) for each cone type (red/green-, blue- and UV-sensitive cones) and for rods are indicated. NDRG1a-1 was found to be expressed in the ellipsoid but not in the OS in rods (arrowhead in a, and upper panels in b). NDRG1a-1 was also found both in the OS and ellipsoid in cones (a and lower panels in b). NDRG1a-2 was found in the thin process of a cone (c,d). NDRG1b was found in the entire region of a cone (e,f) but not in rod ellipsoid (arrowheads in e). In a, c and e, wildtype zebrafish retinas were used, and in the detailed study in b, d and f, the retinas consisting of cones expressing mCherry-HrasCAAX were used to readily identify cones. (g) Schematic representation of localization of NDRG1 family proteins in adult zebrafish photoreceptors (shown in green). DIC, differential interference contrast image. EXPRESSION / LABELING:
|

ZFIN is incorporating published figure images and captions as part of an ongoing project. Figures from some publications have not yet been curated, or are not available for display because of copyright restrictions. |
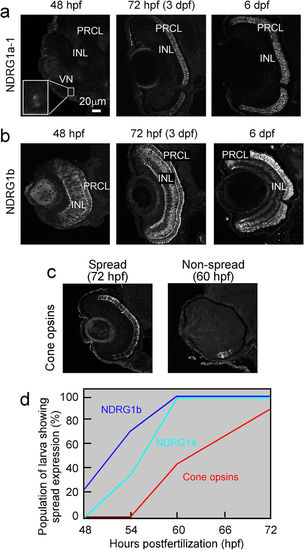
Spatiotemporal expression patterns of NDRG1a-1 and NDRG1b proteins. NDRG1a-1 (a) and NDRG1b (b) were probed with specific antisera against them at the developmental stages indicated. In (a) at 48 hpf, NDRG1a-1 was detected only in the region of ventronasal patch (VN), and subsequently it was detected in the photoreceptor cell layer (PRCL) but not in the inner nuclear layer (INL). In (b), NDRG1b was detected at both the PRCL and INL at 48 and 72 hpf, and its distribution was enriched to PRCL at 6 days postfertilization (dpf). The expression level of each protein at indicated time was estimated with spread/non-spread criterion (c, see Methods), and the result is shown together with that obtained for total cone opsins (d). In (d), data point is the percentage of the number of the retinas showing “spread” image in the total number of the retinas examined (n = 8–10) at each time point (48, 54, 60 and 72 hpf). Magnifications are the same in (a–c) (scale bar, 20 μm). |
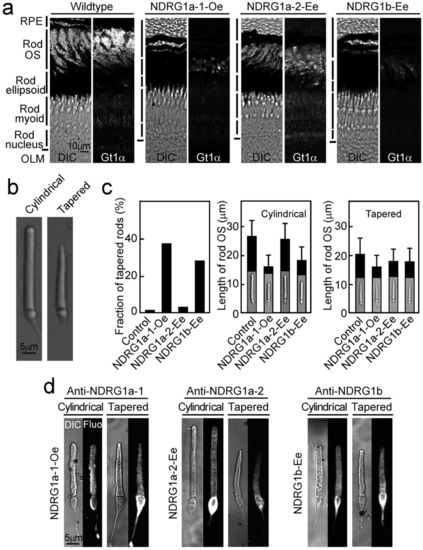
Effects of overexpression of NDRG1a-1, ectopic expression of NDRG1a-2 or NDRG1b in adult zebrafish rods. (a) NDRG1a-1 was overexpressed (NDRG1a-1-Oe), NDRG1a-2 was ectopically expressed (NDRG1a-2-Ee) or NDRG1b was ectopically expressed (NDRG1b-Ee) in zebrafish rods. Each adult retina including that of wildtype (Wildtype) was sectioned and viewed with differential interference contrast (DIC) or immunoprobed with anti-rod transducin α-subunit antibody (Gt1α). Magnifications are the same throughout the images in (a) (scale bar, 10 μm). Vertical bars from top to bottom in the left of each pair of images show a part of a layer of the retinal pigment epithelium (RPE), outer segment, ellipsoid, myoid and nucleus layers, respectively, and horizontal bars show the outer limiting membrane (OLM). The rod outer segment layer can be identified with anti-Gt1α-positive signals (right image in each pair). (b) A rod with normal cylindrical OS (left) and that with tapered OS (right). Magnifications are the same in (b) (scale bar, 5 μm). (c) Rods in mCherry-expressing control (Control), NDRG1a-1-Oe, NDRG1a-2-Ee or NDRG1b-Ee were isolated, and the fraction of tapered rods was determined (left). The number of rods with tapered OS were 2.0% in Control (217 rods with tapered OS and 10429 rods with cylindrical OS in 5 fish), 38% in NDRG1a-1-Oe (539 tapered and 892 cylindrical in 5 fish), 3.8% in NDRG1a-2-Ee (278 tapered and 7011 cylindrical in 4 fish) and 28% in rods in NDRG1b-Ee (1258 tapered and 3155 cylindrical in 4 fish). The length of the rods showing a cylindrical shape (middle) and the length of the rods showing tapered shape (right) were measured in the population indicated above. Each result shows mean ± SD (middle and right). (d) Expression of NDRG1a-1 (left 4 panels), NDRG1a-2 (middle 4 panels) and NDRG1b (right 4 panels) were immunodetected with corresponding specific antiserum in isolated rods showing cylindrical OS (left 2 panels in each set of panels) and those showing tapered OS (right 2 panels in each set) in each transgenic fish. Each rod was viewed with DIC (DIC) or immunofluorescently (Fluo). Magnifications are the same in (d) (scale bar, 5 μm). PHENOTYPE:
|

DDC staining of rods showing taper-shaped OS. (a) Typical DDC staining of wildtype (Wildtype) rods and cones. Only cone OS was stained. (b) Rods with tapered OS obtained from NDRG1a-1-Oe (NDRG1a-1-Oe) and NDRG1b-Ee (NDRG1b-Ee) was negative for DDC staining (upper and lower left 3 panels, respectively). Cone OSs in NDRG1a-1-Oe and NDRG1b-Ee were positively stained (upper and lower right 3 panels, respectively). Cells in (a,b) were viewed with DIC (DIC) and under fluorescent microscope to detect the fluorescence of DDC (DDC). Scale bar is 10 μm in (a). Magnifications are the same in all of the panels in (b) (scale bar, 5 μm). PHENOTYPE:
|

Localization of NDRG1a-1, NDRG1a-2 and NDRG1b proteins in zebrafish retina. Retinal sections were immunoprobed with anti-NDRG1a-1, anti-NDRG1a-2, anti-NDRG1a#, or anti-NDRG1b antiserum (leftmost panel in each of a - d). In (a) - (d), control measurement was made with each antiserum pre-adsorbed by each corresponding NDRG1a family protein (second left panels in a - d). The area surrounded by a dotted rectangular was magnified and is shown in the right two panels in (a) - (d). Arrows in (b) indicate the thin cone process detected by anti-NDRG1a-2 antiserum. Thick vertical white bars in (c) indicate the immunostaining of NDRG1a-1 in the plasma membranes surrounding the rod nucleus (see text). Arrows in (d) indicate NDRG1b positive cells in the inner nuclear layer. RPE, retinal pigment epithelium; PRCL, photoreceptor cell layer; INL, inner nuclear layer; GCL, ganglion cell layer. Scale bars indicate 20 μm throughout this figure. |

Effects of NDRG1a-1 knockdown with a morpholino against ndrg1a-1 (MO1a-1). (a) At 96 hpf, effects of MO1a-1 on photoreceptors were examined. In the retinas of control morpholino-injected (Control) and MO1a-1-injected fish (MO1a-1), expression of rhodopsin and rod transducin were immunodetected. (b) From studies as shown in (a), rod OS area was determined from rhodopsin-immunopositive region (left panels in a) and the number of rods was determined from rod transducin-immunopositive cells (middle panels in a). From these determination, relative rod OS area per rod (left) and relative rhodopsin concentration (right) were estimated for the retinas of control and MO1a-1-injected fish (n = 11 for both Control and MO1a-1). (c) In the retina from MO1a-1-injected fish, red/green-sensitive opsin was immunodetected. (d) Relative cone OS area (left) and relative concentration of red/green-sensitive opsin (right) were estimated in the retinas of control and MO1a-1-injected fish as in (b) (n = 11 for Control and n = 9 for MO1a-1). Magnifications are the same in (a) and (c) (scale bar, 10 μm). *P < 0.005, **P < 0.0000005. PHENOTYPE:
|