
- Title
-
Caudal migration and proliferation of renal progenitors regulates early nephron segment size in zebrafish
- Authors
- Naylor, R.W., Dodd, R.C., Davidson, A.J.
- Source
- Full text @ Sci. Rep.
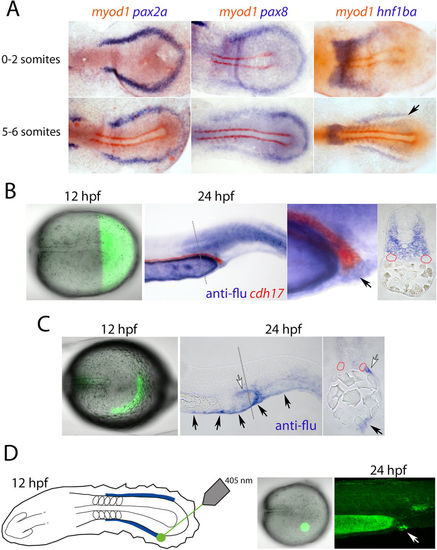
Lineage labelling of the intermediate mesoderm. (A) Panels show dorsal views of flat mounted embryos double stained for pax2a, pax8 and hnf1ba (purple) and myod1 (red) transcripts at the 0-2-somite and 5-6-somite stages. The caudalmost limit of the hnf1ba expression domain in the intermediate mesoderm is indicated with a black arrow. (B) Panels show the results of uncaging a lineage tracer in cells posterior to the end of the notochord (first panel) and the descendants of the labelled cells (purple) compared to the unlabelled cdh17-expressing kidney tubules (red; second and third panels, arrow in third panel labels cloaca cells). The fourth panel shows a cross-section, as indicated by the grey dotted line, of the embryo in panel two (red staining has been lost, but red dotted lines highlight the pronephric tubules). (C) Left panel shows lineage labelling of the ‘horseshoe’ domain at the 5-somite stage (fluorescence observed in the more rostral midline is background). Middle panel shows their contribution to non-renal cell types at 24 hpf by whole mount in situ hybridization. Labelled ventral fin cells are highlighted with black arrows and a population of mesenchyme lateral to the posterior pronephros is indicated with a white arrow, which is also highlighted in the cross-section view in the right panel. (D) Panels show lineage labelling of cloacal precursors (white arrow) located in a small cluster of cells near the end of the intermediate mesoderm. Images in (B,C,D) are shown in lateral view. |

Expression analysis of segment formation in the pronephros. Panels show dorsal views of embryos double stained for slc4a4 (red)/slc12a1 (purple) and slc4a4 (red)/slc12a3 (purple) at the stages indicated. The position of initial slc12a1 expression is highlighted with a black arrow and a schematic representation of the pronephros at 24 hpf is shown in the top left. Abbreviations; PCT, Proximal convoluted tubule; PST, Proximal Straight tubule; DE, Distal Early tubule; DL, Distal Late segment. |
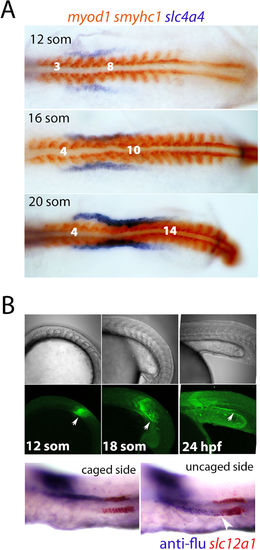
Lineage labelling of renal precursors. (A) Dorsal views of flat-mounted embryos that are double stained for slc4a4 (purple) and myod1/smyhc1 (red) are shown at the indicated stages. (B) Panels show uncaging of a lineage tracer in the intermediate mesoderm lateral to somite 8 at the 12-somite stage and tracking of these cells posteriorly (white arrows) up to the 24 hpf stage (upper panels show live brightfield images, middle panels show live fluorescent images). Lower panels show lateral views of the trunk from the same fate-mapped embryo double stained for the lineage tracer (‘anti-flu’; purple) and slc12a1 (red). |
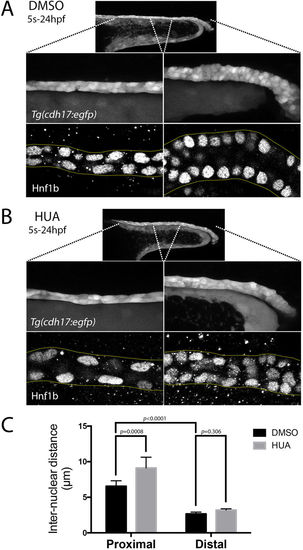
Live morphology of the pronephric tubule. (A,B) Top panels show a lateral view of the pronephric tubule in live Tg(cdh17:egfp) embryos at 24 hpf treated with either DMSO (A) or HUA (B). The two panels below show the same embryos with higher magnification views of the proximal (left) and distal (right) tubule. The bottom panels are single plane lateral views of Hnf1b stained pronephric nuclei in the proximal (left) and distal (right) tubule. (C) Histogram representing the inter-nuclear distances observed in the proximal and distal tubules of DMSO (control) and HUA treated embryos. |

Effects of HUA treatment on tubulogenesis and caudal migration. (A) Left panel shows the PST region and the right panel shows the DL region of an embryo labelled with EdU (red) and Hnf1b (green) at the 24 hpf stage. (B) Transverse sections of Tg(cdh17:egfp) embryos treated with HUA and DMSO and stained with Phalloidin to label F-actin and DAPI to label nuclei. (C) Panels show lateral views of HUA and DMSO treated embryos double stained for cdh17 and uncaged fluorescein (lineage tracer) that was labelled in the intermediate mesoderm lateral to somite 8 at the 12-somite stage. (D) Oblique lateral views of embryos treated with HUA and DMSO (control) and analysed for pax2a, slc4a4, slc12a1 and slc12a3 transcripts (black arrowheads indicate the anteriormost position of the DL segment). |

Laser ablation of the DL segment reduces DE segment size. (A–E) Dorsal views of the trunk of 24 hpf embryos that have undergone laser ablation of the intermediate mesoderm at the 12-somite stage at the indicated positions and double-stained for cdh17 (red) and slc12a1 (purple) transcripts. Manual cell counts of slc12a1+ cells are shown as dot-plots to the right. |

DL caudal compaction regulates proximal tubule proliferation and segment size. (A) Top panels show low magnification lateral views of the same embryo labelled with Hnf1b. Asterix denotes the site of ablation. Bottom panels show close-up views of the highlighted region of the ablated and contralateral control side of the embryo. (B) Histogram of the percentage of Hnf1b nuclei that are EdU+ in the control non-ablated side and ablated side of the tubule in 6 embryos. (C) Panels show lateral views of 24 hpf embryos treated with LY294002 or DMSO (control) and labelled with EdU from the 12-somite stage to 24 hpf. (D) Histogram of the percentage of Hnf1b nuclei that are EdU+ in control and LY294002 treated embryos. |

A) Expression of slc4a4/slc12a 1 at the 18-somite stage. White arrow highlights mixing of these two populations. B) Left panel shows a lateral view of 20-somite stage embryo stained for slc12a3 in red. Middle and right panels show the same embryo but also with slc12a1 staining in purple with the middle panel being a lateral view and the right panel an oblique view. |

Bottom panel shows close up view of uncaged cells that have migrated from lateral to somite 8 at the 10-somite stage to being lateral to somites 12-13 (equivalent to the DE segment) at the 24 hpf stage. Arrow heads in the bottom panel identify doubly labelled cells in the anterior domain of the DE segment. |

Panels show stage series live capture of the same Tg(cdh 17:egfp) embryo between 18 hpf and 30 hpf. White arrow in 18 hpf panel highlights the extending distal pronephros prior to caudal migration and cloacal fusion. |

Top panels show Hnfl b (green) and EdU (red) in the proximal tubule region (left) and distal tubule (right). Histogram at the bottom shows the% of Hnfl b nuclei that are labelled for EdU in the proximal tubule and distal tubule. |

EdU incorporation in HUA and DMSO (control) treated embryos. Panels show lateral views of embryos labelled with EdU (red) for 20 minutes after a two hour treatment with DMSO (control) or HUA from the 22-somite stage. |

Tubulogenesis in the pronephros. Top Panels show brightfield and fluorescence images of the intermediate mesoderm in Tg(cdh 17:egfp) embryos. Bottom panels show lateral views of Tg(cdh 17:egfp) embryos stained for β-catenin at the 12-somite and 20-somite stages (upper) with cell outline tracings (lower). |

Laser ablation of the tubule. Panels show close-up images of Tg(cdh 17:egfp) embryos under brightfield and fluorescence microscopy at the 12-somite stage where 405nm wavelength light on a confocal microscope has ablated the intermediate mesoderm (asterisk marks target site for ablation, white arrowhead highlights the target site immediately post-ablation). |

Panels show lateral views of 24 hpf stage embryos labelled for slc4a4, slc12a1 and slc12a3 in control (DMSO) and LY294002 treated embryos. |