
- Title
-
Heterotypic interactions regulate cell shape and density during color pattern formation in zebrafish
- Authors
- Mahalwar, P., Singh, A.P., Fadeev, A., Nüsslein-Volhard, C., Irion, U.
- Source
- Full text @ Biol. Open
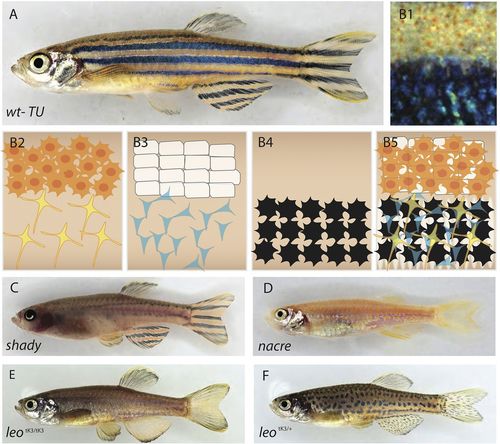
Pigment cell organization in wild-type and mutant zebrafish. (A) Wild-type zebrafish, and (B1) close up view of the stripe pattern showing light and dark stripe regions. (B2-5) Schematic organization of pigment cells: (B2) xanthophores are compact and densely packed in the light stripe, loose and stellate in the dark stripe; (B3) iridophore layer beneath xanthophores – epithelial-like packing of silvery iridophores in the light stripe, loose and blue in the dark stripe; (B4) melanophores are only present in the dark stripe region; (B5) precise superimposition of all the three cell types results in golden light stripes and blue/black dark stripes. (C) shady lack most iridophores. (D) nacre lacks all the neural crest-derived melanophores. (E) Homozygous leopardtK3/tK3. (F) Heterozygous leopard tK3/+. |
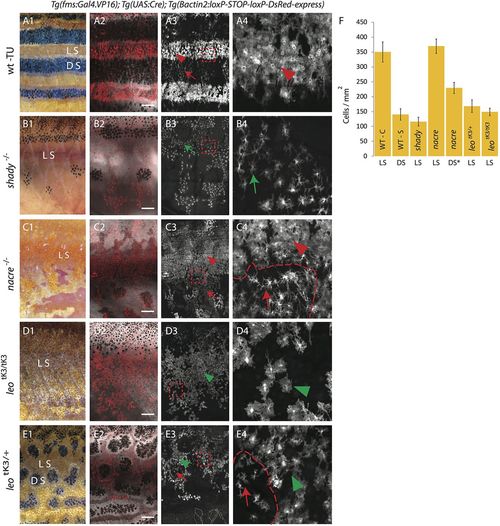
Density and organization of xanthophores in various pigment cell mutants. DsRed-positive xanthophores labeled with Tg(fms:Gal4.VP16); Tg(UAS:Cre); Tg(βactin2:loxP-STOP-loxP-DsRed-express) in wild type and mutants. Due to variegated expression of the transgenes not all xanthophores are labelled. (A1-4) Wild type. (A1) Pigmentation pattern in adult wild-type fish (TU), LS, light stripe; DS, dark stripe. (A2) compact xanthophores (arrowhead) in the light stripe and loose xanthophores (arrow) the in dark stripe areas. (A3) A magnified image of the light stripe region in wild-type fish (red dotted box in A3) shows the high density of compact xanthophores (red arrowhead). (B1-4) Homozygous shady mutants lacking iridophores. (B1,B2) Overview showing the residual melanophore pattern in the mutant. In (B2,B3) the uniform organization of xanthophores (green arrow) is visible. (B4) Magnified image (red dotted box in B3) shows lower density and different morphology of xanthophores (green arrow). (C1-4) Homozygous nacre mutants lacking melanophores. (C1,C2) Overview showing irregular areas of epithelial-like dense iridophores; LS, light stripe. In (C3) the compact (arrowhead) and loose (arrow) shape of xanthophores is visible. (C4) Magnified image (red dotted box in C3) shows high (arrowhead) and low (arrow) density of xanthophores at a light stripe border area (dotted red line). (D1-4) Homozygous leotK3tK3 mutant. (D1,D2) Overview showing that all three pigment cell types are present. In (D3,D4) the low density and uniform distribution of xanthophores (green arrowhead) is visible; (D4) magnified image (red dotted box in D3) shows uniform cell shape and distribution of xanthophores (green arrowhead). (E1-4) Heterozygous leotK3 mutants. (E1,E2) Overview indicating the light stripe (LS) and dark stripe (DS) areas. In (E3) the low density but non-uniform distribution of xanthophores in light (green arrow head) and dark (red arrow) stripe regions is visible. (E4) Magnified image (red dotted box in E3) showing stellate (arrow) and compact (green arrowhead) xanthophores with lower density at a melanophore spot boundary (dotted red line). Scale bars: 500 µm. (F) Graph showing the density (number of xanthophores per mm2) in light or dark stripe regions of wild type and mutants. Values are presented as mean± standard deviation. Asterisk indicate the statistical significance compared to the cell density in wild-type light stripe using Student's t-test. Wild-type compact (WT-C) in light stripe (LS): 349.72 cells/mm2 ±33.67, Wild-type stellate (WT-S) in dark stripe (DS): 139.82 cells/mm2±19.16 (P<0.0001); homozygous shady light stripe (shady -LS): 116.26 cells/mm2±14.55 (P<0.0001), homozygous nacre light stripe (nacre -LS): 369.54 cells/mm2±24.30, homozygous nacre dark stripe (nacre -DS): 229 cells/mm2 ±18, heterozygous, leotK3 light stripe (leotK3/+ - LS): 168.03 cells/mm2±21.06 (P<0.0001), homozygous leotK3 light stripe (leotK3/tK3 - LS): 148.71 cells/mm2±12.28 (P<0.0001). n=10 adult (90 dpf) fish per genotype, except for nacre dark stripe, n=8. |
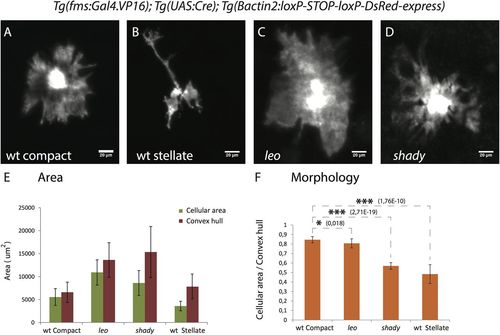
Xanthophore cell morphologies. (A-D) High resolution images of xanthophores in wild type and mutants showing the different morphologies. (A) Wild-type compact xanthophore, (B) wild-type stellate xanthophore, (C) leotK3/tK3 xanthophore and (D) shady xanthophore, scale bar: 20 µm. (E) Graph depicting the cell areas (green bars) and the areas of a simple polygon covering the cells (convex hull, red bars) for individual xanthophores in different genotypes (n=15 adult (90 dpf) fish per genotype). (F) Graph showing the ratios of cellular areas to convex hull areas as a measure to quantify the differences in cell morphology between wild type, leotK3/tK3 and shady mutants. The ratio for compact xanthophores in wild type is significantly higher than for wild-type stellate xanthophores (P<0.0001), xanthophores in leotK3/tK3 (P<0.01) and shady (P<0.0001) mutants. Asterisks indicate the statistical significance using Student's t-test and error bars indicate standard deviations. |
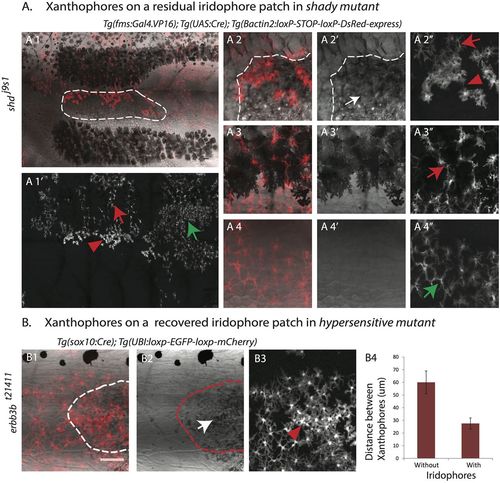
Iridophores lead to a higher density and change in the organization of xanthophores. (A) Adult shady mutant with DsRed-positive xanthophore patches labeled with Tg(fms:Gal4.VP16); Tg(UAS:Cre); Tg(βactin2:loxP-STOP-loxP-DsRed-express). Xanthophores show a compact organization and higher density (red arrowhead in A1′ and A2″) on top of escaper iridophores (outlined in A1 and white arrow in A2′). They are stellate and loosely packed on top of the dark stripe melanophores (red arrow in A1′ and A3″). (A4-4″) Magnified image of the first light-stripe region shows the stellate shape of xanthophores in the absence of the other two pigment cell types (green arrow in A1′ and A4″). (B) erbb3bt21411 metamorphic fish showing a patch of missing iridophores and patchy clones of mCherry-positive xanthophores labeled with Tg(sox10:Cre); Tg(UBI:loxp-EGFP-loxp-mCherry). The recovery of iridophores (outlined in B1 and B2, white arrow in B2) leads to denser and more compact xanthophores (red arrowhead in B3); in the absence of iridophores xanthophores remain at lower density. Scale bar: 100 µm. (B4) Graph showing the distances (in µm) between the centers of neighboring xanthophores in the absence or presence of iridophores (n=15 pairs). |
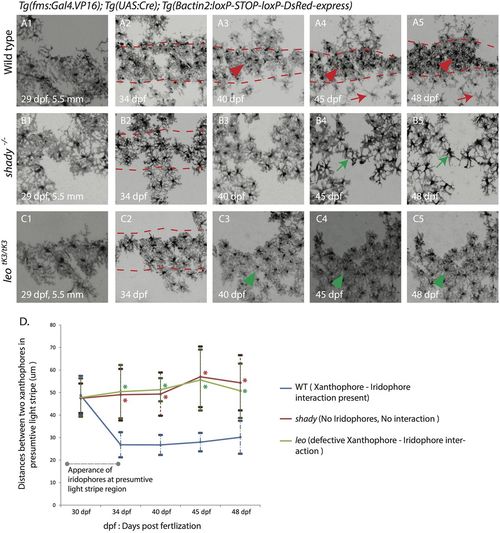
Development of xanthophore distribution and organization during stripe pattern formation. Time-lapse images of DsRed-positive xanthophores labeled with Tg(fms:Gal4.VP16); Tg(UAS:Cre); Tg(βactin2:loxP-STOP-loxP-DsRed-express) in wild type and mutants during metamorphosis. (A1-5) Wild-type xanthophores reorganize upon the arrival of metamorphic iridophores and melanophores form a uniform density into two different forms: stellate and less dense (red arrowhead) in the dark-stripe areas (between the red dotted lines), and compact and dense in the light-stripe areas (red arrowheads). (B1-5) Xanthophores in shady mutants stay at a uniform density (green arrow) in the dark-stripe areas (between the red dotted lines). (C1-5) In homozygous leotK3 mutants xanthophores stay at a uniform density (green arrowhead) all over the body of the fish even after the arrival of iridophores and melanophores, dark-stripe areas are shown between red dotted lines. Scale bars: 100 µm. (D) Graph showing the differences in cell densities during development of wild type, leotK3 and shady mutants. The distances (in µm) between the centers of neighboring xanthophores in the prospective light-stripe regions at various developmental time points are depicted (n=25 cell pairs from 5 fish per genotype). Error bars indicate standard deviations. Asterisks indicate the statistical significance compared to wild type using Student's t-test (all P values are P<0.0001). |
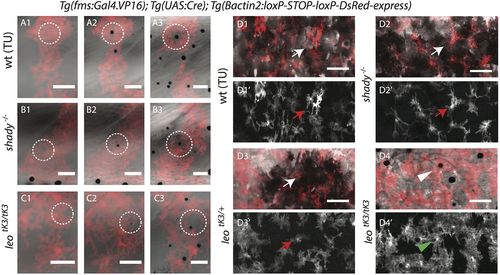
Xanthophore-melanophore interactions. (A-C) Time-lapse recordings of melanophores and DsRed-labeled xanthophores during metamorphosis. (A1-3) Wild-type, (B1-3) shady and (C1-3) homozygous leotK3 mutant xanthophores retract their protrusions to give space to the newly arriving melanophores (inside white dotted circles). (D1-1′) Wild-type, (D2-2′) shady and (D3-3′) heterozygous leotK3/+ xanthophores (white and red arrows) reorganize themselves to adopt stellate shapes upon the arrival of more melanophores in the presumptive dark-stripe regions. (D4-4′) In homozygous leotK3/tK3 mutants xanthophores (green arrowhead, xanthophore above melanophore) do not adopt a stellate shape nor loose morphology. Scale bars: 100 µm. |
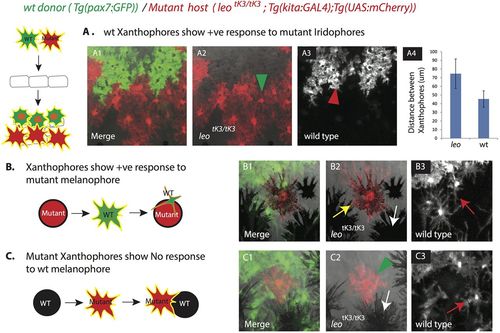
Transplantation of wild-type xanthophores labeled with Tg(pax7:GFP) into leotK3/tK3 mutants carrying Tg(kita:GAL4);Tg(UAS:mCherry). (A1) Different density of wild-type (green cells, red arrow head in A3) and mutant xanthophores (red cells, green arrow head in A2) in an adult chimeric animal. (A4) Graph showing the distances (in µm) between the centers of neighboring wild-type and mutant xanthophore pairs in the chimera, error bars indicate standard deviation (n=15 pairs). (B) A wild-type xanthophore (labeled with GFP) becomes stellate (red arrow in B3) in response to a mutant melanophore (labeled with mCherry, yellow arrow in B2). White arrow in B2 points to wild-type melanophores. (C) No response and change in shape of mutant xanthophores (labeled with mCherry, green arrowhead in C2) in response to wild-type melanophores (no fluorescent label, white arrow in C2). Red arrow in C3 points to wild-type xanthophores (labeled with GFP) showing wild-type morphology in response to wild-type melanophores. |
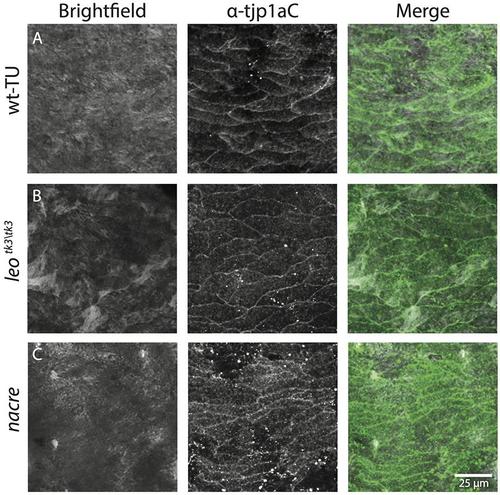
Dense epithelial-like iridophores are present in wild type light stripes, in nacre and in leotK3 mutants. Staining with anti-Tjp1a antibody confirms the presence of dense iridophores in (A) wild type, (B) nacre and (C) leo tK3/tK3 . Scale bar: 25 μm. |
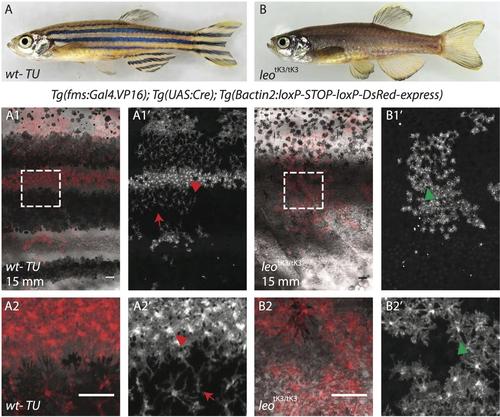
Wild type and leo mutant zebrafish differ in density and organization of xanthophores at 15mm size. (A-A') DsRed labeled xanthophores in wild type fish show dense cells in light stripes (red arrowhead in A') and loose cells in the dark stripes (red arrow in A’). (B-B') DsRed labeled xanthophores in homozygous leotK3 mutants display a uniform density and organization (green arrowhead) with complete absence of stellate xanthophores. Scale bar: 100 μm. |
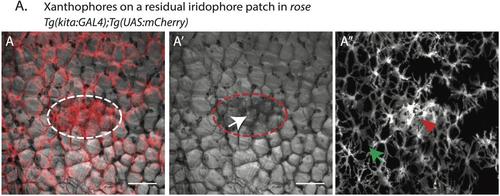
Iridophores lead to a higher density and change in the organization of xanthophores. (A) rose mutant with mCherry labeled xanthophores (A-A''); compact and densely packed xanthophores (red arrowhead in A'') on a patch of escaper iridophores (white arrow in A'); non-compact xanthophores with a lower density (green arrow in A'') in the rest of the body of the fish. Scale bar: 100 μm. |
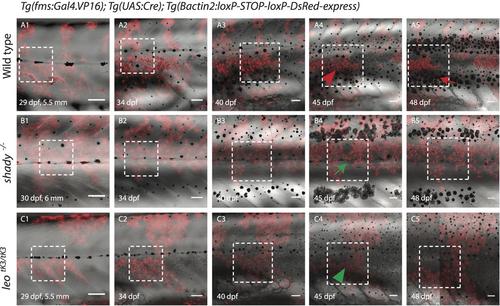
Xanthophore behaviors during stripe formation. (A1-5) Reorganization of xanthophores in wild type upon the arrival of metamorphic iridophores and melanophores, leading to changes in density: stellate and low density in the dark stripe areas, compact and high density in the light stripe areas. (B1-5) In the absence of iridophores in shady mutants, xanthophores maintain a uniform density. (C1-5) Xanthophores in homozygous leotK3 mutants maintain a uniform density (green arrowhead) all over the body of the fish even after the arrival of iridophores and melanophores. Scale bars: 100 μm. Dotted white boxes indicate the areas shown in Fig.5. |
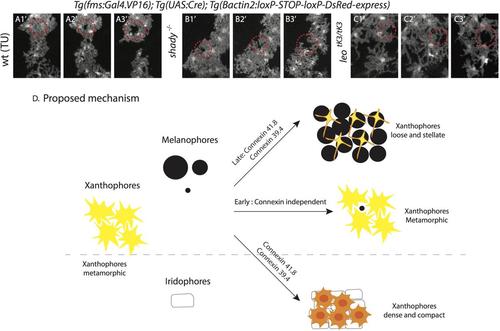
Interactions between xanthophores and the other pigment cells. (A) Bright field of time lapse recordings of melanophores and DsRed labeled xanthophores during metamorphosis (corresponding to Fig. 6). (A1'-3') wild type, (B1'-3') shady and (C1'-3') homozygous leotK3 mutant xanthophores (inside white dotted circles) retract their protrusions to give space to the newly arriving melanophores. (D) Cartoon representation of proposed cellular interactions. The communication between xanthophores and iridophores is mediated by connexins41.8 and 39.4. The melanophore-xanthophore communication is a multi-step process, initially xanthophores react to incoming melanophores independently of the known connexins, however, later steps are dependent on Cx41.8 and Cx39.4. |