
- Title
-
Caspase-mediated apoptosis induction in zebrafish cerebellar Purkinje neurons
- Authors
- Weber, T., Namikawa, K., Winter, B., Müller-Brown, K., Kühn, R., Wurst, W., Köster, R.W.
- Source
- Full text @ Development

Purkinje cell-specific expression of a tamoxifen-inducible caspase. (A) Schematic diagram of the Caspase 8 activation. Caspase 8 fused to the mutant estrogen receptor ligand-binding domain (ERT2) dimerizes upon addition of tamoxifen (4OHT; orange double-headed arrow). Subsequent proteolytic self-activation of Caspase 8 leads to activation of endogenous Caspase 3 and cell apoptosis. (B) Construct design for the generation of stable transgenic zebrafish PC-ATTACTM strain. Membrane-bound fluorescent FyntagRFP together with Caspase8ERT2 linked by a self-cleaving T2A-peptide is co-expressed under the control of a Purkinje cell-specific regulatory element (PC) from carbonic anhydrase 8, which is combined with a CMV basal promoter (CMV). (C) F2 transgenic larvae were analyzed at 5 dpf by confocal microscopy to verify transgene encoding FyntagRFP expression exclusively in the cerebellum. (D,E) Purkinje cell (PC)-specific expression of the transgene was confirmed by double-immunostaining against (D) FyntagRFP (red) and ZebrinII (green), and (E) Caspase 8 (green, combined with FyntagRFP fluorescence), demonstrating that Caspase8ERT2 expression is confined to FyntagRFP-fluorescent ZebrinII-expressing PCs. (F) Owing to membrane targeting of FyntagRFP axons, somata and dendrites of PCs, including the long axonal projections forming the cerebello-octavolateralis tract to vestibular nuclei (white arrowheads), could be monitored. (G) Concomitant Caspase8ERT2 and FyntagRFP-T or FyntagRFP expression was verified by western blot analysis. FyntagRFP-T (bz4Tg, Matsui et al., 2014) alone was used as a control. PC, Purkinje cell; OC, otic vesicle. Scale bars: 10 μm (E) and 20 μm (F). |
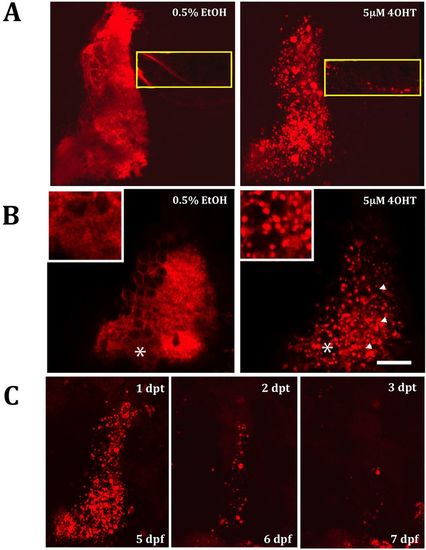
Tamoxifen-induced PC death in PC-ATTACTM fish. (A,B) Incubation of 4 dpf PC-ATTACTM embryos (n=6) in 4OHT (5×10⁻⁶M) for 16 h induces cell death of PCs in larvae at 5 dpf compared with controls treated with 0.5% EtOH. Cell ablation was visible by way of large amounts of PC debris (white arrowheads in B). The extensive dendritic layer was completely disrupted (the asterisks mark the region shown in the inset in B) and the projections of the cerebello-octavolateralis were fragmented (yellow square in A). (C) PC-ablated larvae re-analyzed 24, 48 and 72 h after tamoxifen treatment show decreasing amounts of red fluorescent PC debris and a lack of fast PC recovery. Scale bars: 20 µm; dpt, days post-treatment. |
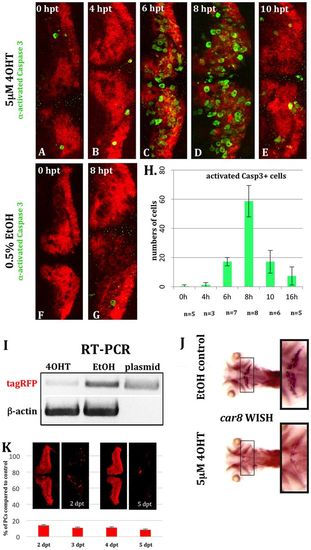
Time course of apoptosis in PC-ATTACTM larvae. (A-G) Whole-mounts of 5-dpf transgenic PC-ATTACTM embryos were stained with an antibody against activated Caspase 3 (green) after treatment at 4 dpf with 5×10⁻⁶M 4OHT (A=0 h; B=4 h; C=6 h; D=8 h; E=10 h) or 0.5% EtOH (F=0 h; G=8 h). (H) Significant elevation of apoptosis could be observed after 6 h, peaking after 8 h of 4OHT treatment based on PC counts at 4 dpf. (I-K) To score the extent of PC ablation over time, we performed 4OHT treatments with 4 dpf heterozygous larvae for 16 h (compared with 0.5% EtOH controls) and analyzed the cell death 24 h later. (I) RT-PCR revealed a strong reduction of fyntagRFP mRNA for 4OHT-treated larvae in contrast to EtOH controls with β-actin used as ubiquitously expressed control gene. (J) Although mRNA in situ hybridization (n=5) showed carbonic anhydrase 8 (ca8) expression was prominent in the cerebellum in control larvae, virtually no ca8 expression was visible in PC-ablated specimens (black squares). (K) PC counts 2 and 5 days post-treatment (dpt) revealed a 90% reduction in PC number compared with EtOH controls (K). hpt, hours post-treatment. |

Caspase8ERT2-mediated apoptosis elicits no acute adverse effects on granule and eurydendroid cells. (A) Schematic of zebrafish cerebellar neurons and circuits. (B-D) Heteorzygous PC-ATTACTM fish were crossed with carriers of the Tg(gata1:egfp) strain marking granule cells by green fluorescence (B,C) or with Tg(olig2:egfp) carriers displaying green fluorescent eurydendroid cells (D). Double transgenic 4 dpf larvae were treated with EtOH (B) or 4OHT (C,D) for 16 h to induce PC ablation followed by confocal microscopy image recording. (C) gata1:egfp-expressing GCs, somata (arrows) and their axonal projections – the parallel fibers (asterisks) – showed no signs of cell death, in contrast to fragmented PCs after 4OHT treatment. (D) The same was true for olig2:egfp-expressing eurydendroid cells. Scale bars: 20 µm. BC, basket cell; CF, climbing fiber; EC, eurydendroid cell; GC, granule cell; GOC, Golgi cell; MF, mossy fiber; PC, Purkinje cell; SC, stellate cell. Scale bars: 40 μm. |

Phagocytosis of apoptotic bodies by microglia. (A-C) Double transgenic PC-ATTACTM/Tg(pU.1:gal4-uas:egfp) larvae with green fluorescent microglial cells in the zebrafish brain. PC ablation (16 h of 4OHT treatment) caused an increase in the numbers of microglial cells specifically in the cerebellum (B,D), accompanied by microglial activation based on ramified to ameboid morphology changes (E). (C) 4OHT treatment of Tg(pU.1:gal4-uas:egfp) control larvae had no effect on microglial cells. CCe, corpus cerebelli; TeO, tectum opticum. *P<0.05, ***P<0.001 (Student's t-test); n.s., not significant. |
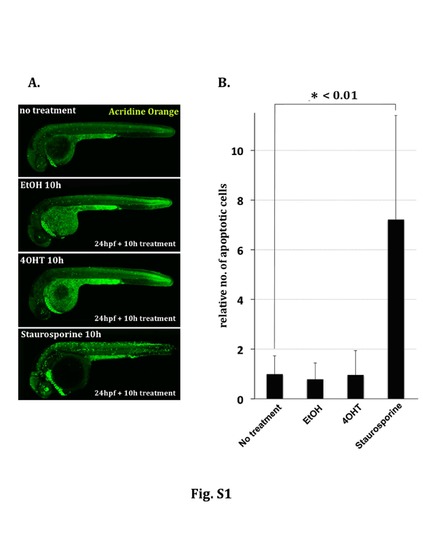
Apoptosis induction by EtOH and 4OHT treatment in zebrafish larvae. (A) Treatments (0.5% EtOH, 5μM 4OHT, 3μM Staurosporine, or non-treatment) were started using wild type zebrafish embryos at 24hpf followed by apoptotic cell detection with acridine orange staining 10hrs later. Whereas Staurosporine treatment induced significant numbers of apoptotic cells, both EtOH- and 4OHT-treated embryos showed similar signals to those obtained in non-treated specimens. (B) Each bar in the graph indicates the relative number of acridine orange positive dying cells throughout the spinal cord region in relation to apoptotic cells in untreated embryos. Counting of the number of apoptotic cells was performed using confocal z-stack images of the spinal cord from 5 independent embryos in each group. * <0.01: p value is lower than 0.01 by Student´s t-test. |
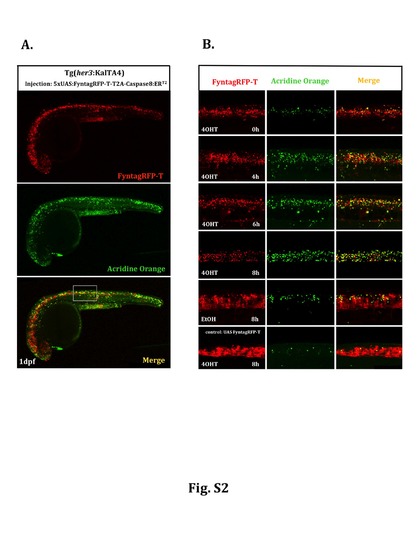
Temporal profile of apoptosis induction by inducible caspase. Heterozygous Tg(her3:KalTA4)hzm9Tg embryos were injected at the one cell stage with a plasmid carrying 5xUAS:FynTagRFP-T-T2A-Caspase8ERT2, followed by acridine orange staining on injected embryos at 24hpf. (A) Gal4/UAS-mediated tissue specific gene expression results in red fluorescent FyntagRFP-T positive cells throughout the ventral central nervous system including the brain, the spinal cord and the retina. Green fluorescent acridine orange staining was used to detect dying cells. To follow the time course of induction of apoptosis a region in the spinal cord marked by a white rectangle was analyzed at higher magnification. (B) In this spinal cord domain the number of green fluorescent dying cells (column in the middle) is increasing upon 4OHT treatment reaching highest levels around 8 hours after initiation of Tamoxifen incubation. Compared to normal developmental levels of apoptosis in embryos injected with the control plasmid 5xUAS:FynTagRFP-T (6th row), 5xUAS:FynTagRFP-T-T2A-Caspase8ERT2-injected embryos treated with EtOH showed an increase in apoptotic cell death (5th row) indicating that the activity of the inducible caspase is leaky under transient transgenic conditions, but can be induced to much higher levels of apoptosis upon Tamoxifen-mediated caspase activation (please compare 4th with 5th row). |

Quantification of induced apoptosis. (A) Higher magnified images of spinal cord cells expressing FyntagRFP-T/Caspase8ERT2 (upper and middle row in A), and control FyntagRFP-T (lower row). Significant induction of apoptosis was observed in almost all FyntagRFP-T expressing cells 8 hours after 4OHT treatment (middle). Compared to control embryos expressing only FyntagRFP-T with virtually no apoptotoc cells (lower row), FyntagRFP-T/Caspase8ERT2 -injected embryos treated with EtOH displayed an increased level of apoptosis (upper row) but clearly to a lesser extend than 4OHT treated embryos. (B) Quantification of the percentage of these apoptotic cells was performed by calculating the number of acridine orange/ tagRFP-T double positive cells relative to all tagRFP-T positive cells. Cells were counted on confocal z-stack images through the spinal cord from 5 independent embryos each. * <0.01 : p value is lower than 0.01 by Student´s t-test. |

Cell type specificity of apoptosis induction. Induction of apoptosis in different cells types was investigated by injection of the plasmid 5xUAS:FyntagRFP-T-T2A-Caspase8ERT2 (A) or 5xUAS:FynVenus-T2A-Caspase8ERT2 (B and C) into embryos of the different KalTA4-expressing driver strains hzm9Tg, hzm6Et and hzm8Et respectively at the one cell stage. At 24hpf injected embryos were treated for 6 hours with either EtOH (upper row) as control or 4OHT (lower row) to induce apoptosis. Subsequently, the embryos were fixed in 4%PFA/PBS and analyzed by immunohistochemistry against activated Caspase3 as indicator of apoptosis. Due to a reduced stability of FynVenus upon fixation, FynVenus expression was enhanced by immunohistchemistry using an anti-GFP antibody. Sacle bar: 10μm (insets and highly magnified images). (A) Tg(her3:KalTA4)hzm9 embryos injected with 5xUAS:FyntagRFP-T-T2A-Caspase8ERT2 reveal FyntagRFP-T-expressing red fluorescent cells in the ventral spinal cord with elevated levels of apoptosis marked by green fluorescent detection of activated Caspase3 compared to EtOH-controls. (B) hzm6Et embryos driving KalTA4-expression under control of the krox20 enhancer throughout rhombomere 3 and 5 (Distel et al., 2009) injected with 5xUAS:FynVenus-T2A-Caspase8ERT2 reveal FynVenus-expressing green fluorescent cells in the hindbrain demarcating rhombomere 3 and 5 with elevated levels of apoptosis marked by red fluorescent detection of activated Caspase3 compared to EtOH-controls. (C) hzm8Et embryos driving KalTA4-expression under control of an unkown skeletal muscle enhancer (Distel et al., 2009) injected with 5xUAS:FynVenus-T2A-Caspase8ERT2 reveal FynVenus-expressing green fluorescent cells in muscles along the trunk with elevated levels of apoptosis marked by red fluorescent detection of activated Caspase3 compared to EtOH-controls. |
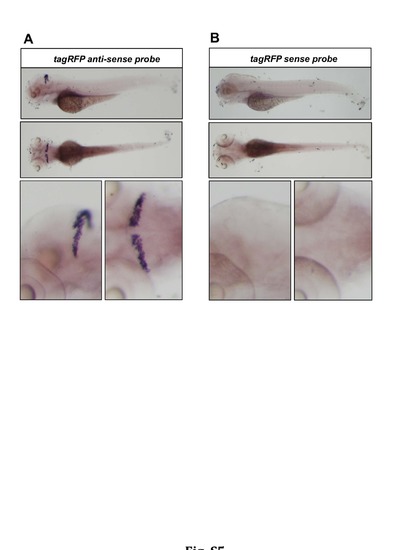
Transgene expression is confined to the cerebellum. (A) In situ hybridization analysis on 4dpf old larvae from the stable transgenic PC-ATTACTM strain revealed that mRNA for tagRFP is exclusively expressed in the cerebellum. (B) PC-ATTACTM larvae hybridized with the sense probe were used as control. |
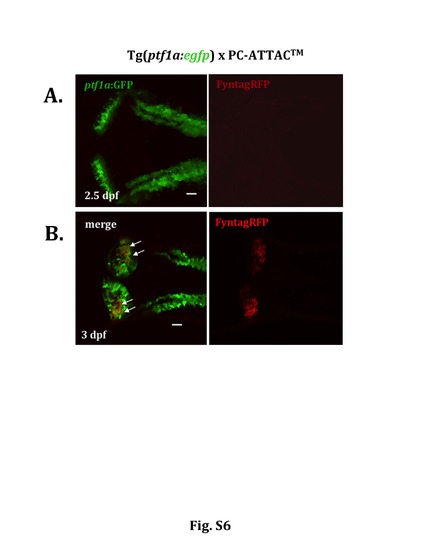
Expression of inducible Caspase8ERT2 is initiated in differentiating cerebellar Purkinje cells at around 3 dpf. Dorsal views of the cerebellum of double transgenic PC-ATTACTM larvae in the Tg(ptf1a:egfp) background recorded by confocal laser scanning microscopy. (A) While the GFP-expressing GABAergic progenitor cells were readily visible in the wing-like structures of the cerebellar primordium at 2.5dpf red fluorescent Purkinje cells expressing the inducible Caspase8ERT2 were not yet detectable. (B) At 3 dpf numerous red fluorescent differentiating Purkinje cells had appeared co-expressing GFP (white arrows), which is consistent with the previous finding that Purkinje cells are derived from cerebellar GABA-ergic progenitors (Hibi and Shimizu, 2012). Thus the inducible Caspase8ERT2 becomes expressed between 2.5 and 3dpf respectively in transgenic PC-ATTACTM larvae. Scale bar: 20μm. |

Integrity of Purkinje cell layer in PC-ATTACTM adults. Immunohistchemical detection of Purkinje cell specific FyntagRFP and ZebrinII expression on sagittal sections through the cerebellum of adult fish older than 15 months from the control Tg(PC:FyntagRFP-T)bz4Tg (left) and the PC-ATTACTM (right) strains. Both lines showed intensive FyntagRFP-T/FyntagRFP expression respectively without any signs of dendritic atrophy (upper row, red fluorescence, insets display overview over entire cerebellum), and ZebrinII expression (lower row, green fluorescence) revealed that no apparent Purkinje cell loss was observed in the PC-ATTACTM cerebellum compared to controls. DAPI was used as counter stain (blue fluorescent signals). Abbr.: GCL: granule cell layer, ML: molecular layer, PCL: Purkinje cell layer. Scale bar: 75μm. |

Eurydendroid cells are largely unaffected by PC apoptosis. Double transgenic PC-ATTACTM larvae crossed into Tg(olig2:egfp) background were subjected at 4dpf to 4OHT treatment to examine the effect of Purkinje cell ablation on olig2:egfp expressing green fluorescent eurydendroid cells. (A) CLSM image of right cerebellar hemisphere of 4dpf larva showed intact FyntagRFP-expressing Purkinje cells (red) and eurydendroid cell somata (green). (B and C) 4OHT-induced Purkinje cell ablation resulted in the significant reduction of FyntagRFP fluorescence over time (B) at 5dpf directly after the 16hrs of 4OHT-treatment or (C) at 6dpf 24 hours after the 4OHT-treatment was finished, respectively. Green fluorescent eurydendroid cells (ECs) instead were not affected by the Purkinje cell ablation over the whole duration of observation. |