
- Title
-
Selenoprotein H is an essential regulator of redox homeostasis that cooperates with p53 in development and tumorigenesis
- Authors
- Cox, A.G., Tsomides, A., Kim, A.J., Saunders, D., Hwang, K.L., Evason, K.J., Heidel, J., Brown, K.K., Yuan, M., Lien, E.C., Lee, B.C., Nissim, S., Dickinson, B., Chhangawala, S., Chang, C.J., Asara, J.M., Houvras, Y., Gladyshev, V.N., Goessling, W.
- Source
- Full text @ Proc. Natl. Acad. Sci. USA

seph mutant zebrafish exhibit defects in organ development. (A) Schematic illustrating the nature of the seph mutant. (B) Survival of WT and homozygous seph mutant larvae over time. n = 160 larvae. (C) Morphological assessment and fluorescent imaging (lateral and ventral views) of WT and seph mutant larvae on a Tg(ela3l:GFP;fabp10a:dsRed) background by confocal tomography at 5 dpf. Liver volume: WT, 3.09e6 µm3; seph, 1.69e6 µm3. Pancreas volume: WT, 2.79e6 µm3; seph, undetectable. (Scale bar: 100 µm.) (D) Quantitative analysis of fluorescent liver area in WT and seph mutant larvae at 5 dpf. n = 16. ****P < 0.0001. (E) Quantitative analysis of fluorescent pancreas area in WT and seph mutant larvae at 5 dpf. n = 16. ****P < 0.0001. PHENOTYPE:
|

ZFIN is incorporating published figure images and captions as part of an ongoing project. Figures from some publications have not yet been curated, or are not available for display because of copyright restrictions. PHENOTYPE:
|

SepH deficient larvae are prone to oxidative stress. (A) Fluorescent detection of H2O2 (PF2 fluorescence) in WT and seph mutant larvae at 5 dpf. (Scale bar: 200 µm.) (B) Quantification of H2O2 in WT and seph mutant larvae at 5 dpf. n = 5. **P < 0.01. (C) Morphological assessment of WT and seph mutant larvae exposed to menadione (1 µM) from 3 to 5 dpf. (Scale bar: 200 µm.) (D) Quantification of phenotype (unaffected, moderate, or severe) observed following menadione (1 µM) exposure from 3 to 5 dpf. Moderately affected larvae include minor defects, such as edema and tail curling, whereas severely affected larvae include major defects, such as widespread tissue necrosis (loss of transparency). PHENOTYPE:
|
|
ZFIN is incorporating published figure images and captions as part of an ongoing project. Figures from some publications have not yet been curated, or are not available for display because of copyright restrictions. |

seph mutants are sensitive to DNA damage. (A) Immunoblot analysis of p53 expression in WT and seph mutant larvae at 5 dpf. (B) Survival of WT and seph mutant larvae 2 dpe to UV irradiation (200 J/m2, 7 dpf). n = 7. ****P < 0.0001. (C) Survival of WT and seph mutant larvae 2 dpe to camptothecin (1 µM). n = 10. ****P < 0.0001. (D) Morphological and histological analysis of WT, seph-/- and tp53-/-;seph-/- mutant larvae at 5 dpf. The yellow dashed region represents the liver. The region of histology showing the larval liver is shown in the zoomed images. [Scale bars: 200 µm (brightfield; BF) and 50 µm (histology; H+E).] (E) Quantitative analysis of liver, pancreas, and gut area in WT, seph-/-, and tp53-/-;seph-/- mutant larvae at 5 dpf. n > 8. *P < 0.05; ****P < 0.0001. |

seph genetically interacts with p53 deficiency to accelerate GI tumor formation. (A) Scheme illustrating the protocol used to study DMBA-induced tumorigenesis. (B) Example of a GI tumor in a tp53-/-;seph+/- fish exposed to DMBA. (Scale bar: 2 mm.) (C) Kaplan-Meier analysis of Tumor-free survival in tp53-/- and tp53-/-;seph+/- fish exposed to DMBA. n > 25 fish. P = 0.0344, Mantel-Cox log-rank test. (D) The incidence of pancreatic cancer, liver cancer, intestinal cancer, and malignant spindle cell neoplasm in tp53-/- and tp53-/-;seph+/- fish exposed to DMBA. (E) Histological evaluation of GI tumors identified in tp53-/-;seph+/- fish showing examples of PACC, HCC, and malignant spindle cell neoplasm (MSCN). (Scale bar: 100 µm.) PHENOTYPE:
|

seph mutant Zebrafish exhibit defects in organ development. (A) Sequence of seph mutant reveals the viral insertion in the 3′ UTR that displaces the SECIS regulatory element that is required for selenoprotein synthesis. (B) WISH analysis of seph expression in WT and seph mutants at 3 dpf. (Scale bar: 200 µm.) (C) Fluorescent imaging of WT and seph mutant larvae on a Tg(gata6:GFP) background at 5 dpf. (Scale bar: 200 µm.) (D) Fluorescent imaging of WT and seph mutant larvae on a Tg(fabp2:dsRed) background at 7 dpf. (Scale bar: 200 µm.) (E) WISH analysis of fabp10a (liver), trypsin (pancreas), and fabp2 (intestine) expression in WT and seph morphants (2 ng, ATG morpholino) at 3 dpf. (Scale bar: 200 µm.) (F) WISH of fabp10a (liver), trypsin (pancreas), and fabp2 (intestine) expression in WT and seph mutants at 3 dpf. (Scale bar: 200 µm.) (G) Morphological assessment illustrating the rescue of the seph mutant phenotype by the injection of SelH-GFP mRNA (GFP-SelHSec38Cys and SelHSec38Cys-GFP constructs) at the one-cell stage. (H) Quantitative determination of the rescue of the seph mutant phenotype by the injection of SelH-GFP mRNA (GFP-SelHSec38Cys and SelHSec38Cys-GFP constructs) at the one-cell stage. EXPRESSION / LABELING:
PHENOTYPE:
|
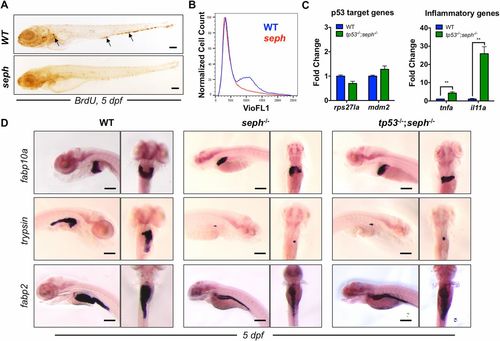
p53 activation and cell cycle arrest contribute to the SepH-deficient phenotype. (A) Whole-mount immunohistochemical analysis of BrdU incorporation in WT and seph mutants at 5 dpf. Arrows point to clusters of BrdU-positive cells. (Scale bar: 200 µm.) (B) FACS analysis of the cell cycle in WT (blue) and seph mutants (red) at 5 dpf as determined by Hoechst staining (VioFL1). (C) qPCR expression analysis of specific genes associated with p53 activation (rps27l and mdm2) and an inflammatory response (tnfa and il11a) in WT and tp53-/-;seph-/- mutant larvae at 5 dpf. n = 3. **P < 0.01. (D) WISH analysis of fabp10a (liver), trypsin (pancreas), and fabp2 (intestine) expression in WT, seph-/-, and tp53-/-;seph-/- mutant larvae at 5 dpf. (Scale bar: 200 µm.) |
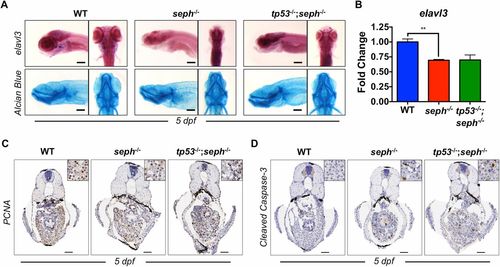
The seph mutant phenotype is partially mitigated by loss of p53. (A) WISH analysis of elavl3 (neurons) expression and Alcian blue staining in WT, seph-/-, and tp53-/-;seph-/- mutant larvae at 5 dpf. (Scale bar: 200 µm.) (B) qPCR expression analysis of the neuron-specific gene elavl3 in WT, tp53-/-, and tp53-/-;seph-/- mutant larvae at 5 dpf. n = 3. **P < 0.01. (C) Immunohistochemical detection of PCNA (proliferation) from transverse sections from WT, seph-/-, and tp53-/-;seph-/- mutant larvae at 5 dpf. (Scale bar: 50 µm.) (D) Immunohistochemical detection of cleaved caspase-3 (apoptosis) from transverse sections from WT, seph-/-, and tp53-/-;seph-/- mutant larvae at 5 dpf. (Scale bar: 50 µm.) |
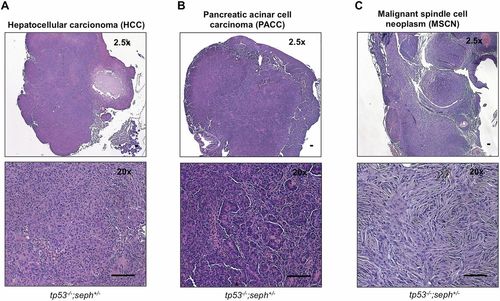
seph genetically interacts with p53 deficiency to accelerate GI tumor formation. (A) Histological example of PACC in a tp53-/-;seph+/- fish. (Scale bar: 100 µm.) (B) Histological example of HCC in a tp53-/-;seph+/- fish. (Scale bar: 100 µm.) (C) Histological example of a malignant spindle cell neoplasm in a tp53-/-;seph+/- fish. (Scale bar: 100 µm.) |