
- Title
-
Vegfa signals through ERK to promote angiogenesis, but not artery differentiation
- Authors
- Shin, M., Beane, T., Quillien, A., Male, I., Zhu, L.J., Lawson, N.D.
- Source
- Full text @ Development
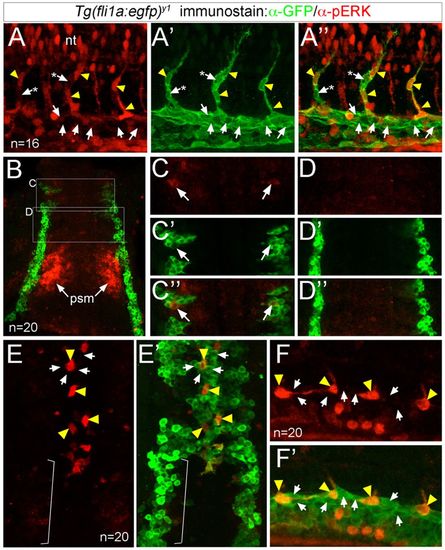
ERK is phosphorylated in sprouting ISV endothelial cells. (A-F′) Confocal images of endothelial cells in Tg(fli1a:egfp)y1 embryos immunostained to detect pERK (red) and GFP (green). Yellow arrowheads indicate pERK-positive endothelial cells, and arrows denote pERK-negative endothelial cells. In A-A″, asterisks denote pERK-negative endothelial cells in the ISV adjacent to pERK-positive cells. (A-A″) Embryo at 24 hpf showing pERK immunostaining (A), GFP immunostaining (A′), or an overlay of pERK and EGFP (A″). (B-D″) Embryo at 10 ss (dorsal view, anterior is up) showing pERK immunostaining (C,D), GFP immunostaining (C′,D′) and the overlay (B,C″,D″). Boxed regions in B indicate areas of higher magnification in C-D″. ERK staining in the presomitic (psm) mesoderm is indicated. (E,E′) Embryo at 18 ss (dorsal view, anterior is up) showing pERK immunostaining (E), and an overlay of pERK and GFP immunostaining (E′). Bracket indicates endothelial cells that have not yet migrated to the midline and are pERK negative. (F,F′) Embryo at 20 ss (lateral view, anterior to the left, dorsal is up) showing pERK immunostaining (F) and an overlay of EGFP expression and pERK immunostaining (F′). Number of embryos analyzed is indicated. EXPRESSION / LABELING:
|
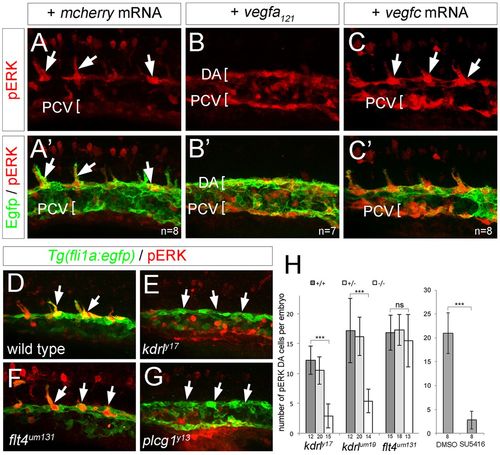
ERK phosphorylation in sprouting ISVs requires Vegfa signaling. (A-G) Confocal images of Tg(fli1a:egfp)y1 embryos at 21 hpf (A-C′) and 20 hpf (D-G) immunostained for GFP (green) and pERK (red). Lateral views, anterior to the left, dorsal is up. Number of analyzed embryos is indicated, representative images are shown. Embryos were injected with 100 pg mcherry mRNA (A,A′), 25 pg vegf121 mRNA (B,B′) or 100 pg vegfc mRNA (C,C′). (D) Wild-type embryo. (E) kdrly17 mutant embryo. (F) flt4um131 mutant embryo. (G) plcg1y13 mutant embryo. Arrows indicate pERK-positive cells, or lack thereof. (H) Graph showing number of pERK+ endothelial cells per embryo at 20 hpf in a defined segment of the DA in kdrl and flt4 mutant embryos, or in embryos treated with 10 µM SU5416. Number of embryos for each genotype or treated with compound is indicated on the x-axis. Error bars represent s.d.; ***P<0.001; ns, not statistically significant. EXPRESSION / LABELING:
PHENOTYPE:
|
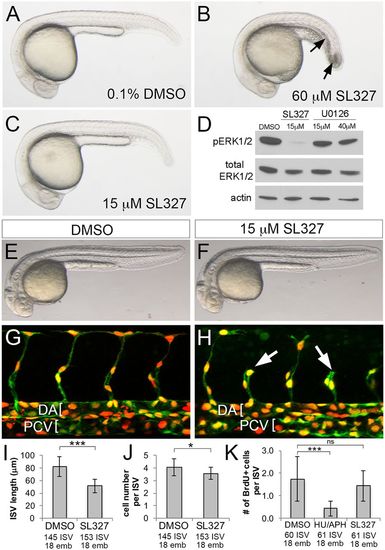
Chemical inhibition of ERK blocks ISV sprouting. (A-C) Transmitted light images of embryos treated with the indicated compound and concentration from 10 hpf to 24 hpf. Arrows in B indicate necrosis. (D) Western blot analysis of pERK, total ERK and actin in embryos treated from 24 to 25 hpf as indicated. (E-H) Transmitted light images (E,F) and confocal images (G,H) of Tg(cdh5:gal4ff)mu101;(uas:nTom)um152;(uas:egfp)nkuasgfpa1 embryos at 32 hpf. Embryos were treated with 0.1% DMSO (E,G) or 15 µM SL327 (F,H) from 20 to 32 hpf. DA and PCV are denoted by brackets in G,H and shorter ISVs are indicated by arrows in H. (I-K) Quantification of ISV length (I), cell number per ISV (J) and BrdU-positive cells per ISV (K) following treatment with the indicated compound. *P<0.05, ***P<0.001; ns, not statistically significant; numbers of ISVs and embryos counted across three experiments are indicated on the x-axis. Error bars represent s.d. |

Endothelial cell-autonomous inhibition of ERK blocks ISV sprouting. (A,B) Confocal images of Tg(cdh5:gal4ff)mu101;(uas:egfp)nkuasgfpa1 embryos bearing the indicated transgenes. uas:egfp is green, nTom is red; selected nTom-positive cells indicated by arrows. Vessel positions shown on the right. (C) Contribution of nlsTom- or dusp6dm-expressing cells to the indicated vessel between 30 and 32 hpf. ***P<0.001. (D,E) Confocal images of Tg(cdh5:gal4ff)mu101 embryos injected with Tol1 transgenes expressing nTom (D) or actMek2b (E) immunostained for Myc (green) and Fli1b (red). Arrows denote transgene-expressing ISV cells. (F) Quantification of nTom- and actMek2b-expressing endothelial cells in the indicated vessel at 23 hpf. (C,F) Numbers of cells and embryos used for quantification are shown. Error bars represent s.d. EXPRESSION / LABELING:
|

ERK activation is essential for flt4 and dll4 expression in sprouting ISVs. (A-A″) Confocal images of embryo co-stained for flt4 transcript (green) and pERK (red). Yellow arrows denote ISVs, white arrowheads indicate non-expressing cells in the dorsal aorta. (B-M) Whole-mount in situ hybridization with riboprobes against the indicated transcripts (flt4, kdrl or dll4). Unless otherwise noted, arrows indicate ISVs in all panels; in B and E, tip and trailing positions are noted by arrows. In B-D, arrowheads denote expression (or lack thereof) in intervening DA endothelial cells. In B-E, blue brackets indicate PCV. Compound used for treatment indicated at left, interval of treatment and analysis stage indicated at right. (N) Quantification of marker expression; treatment stages and concentrations are indicated, as are numbers of embryos used for analysis. ***P<0.001; ns, not statistically significant. EXPRESSION / LABELING:
PHENOTYPE:
|
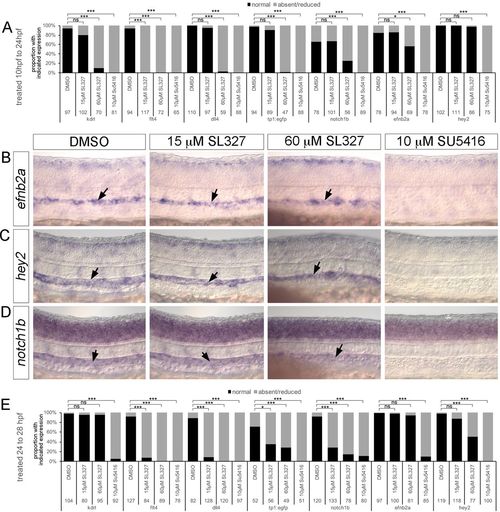
ERK inhibition does not affect initial artery differentiation. (A,E) Quantification of marker expression following treatment with the indicated compounds from 10 to 24 hpf (A) or 24 to 28 hpf (E). Numbers of embryos used for analysis and probes are indicated. *P<0.05, ***P<0.001; ns, not statistically significant. (B-D) Whole-mount in situ hybridization on 24 hpf embryos treated as indicated from 10 hpf using probes against efnb2a (B), hey2 (C) or notch1b (D). Arrows denote staining in the DA. |
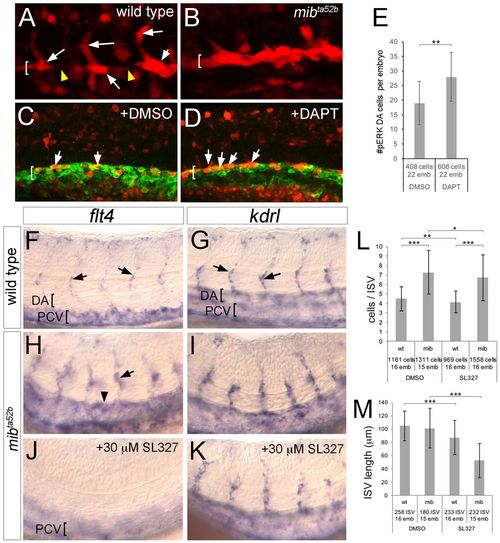
Ectopic ERK activation in Notch-deficient embryos induces flt4 and the hyper-angiogenic phenotype. (A,B) Embryos of the indicated genotype at 21 hpf immunostained for pERK (red). (C,D) Tg(fli1a:egfp)y1 embryos immunostained for GFP (green) and pERK (red) at 20 hpf following treatment with the indicated compound from 14 hpf. In A-D, DA is indicated by bracket; arrows denote pERK-positive cells; arrowheads indicate pERK-negative DA cells. (E) Quantification of pERK-positive DA endothelial cells following treatment with DMSO or 100 µM DAPT. (F-K) Whole-mount in situ hybridization with riboprobes against the indicated transcript (top). Arrows denote ISVs; arrowhead shows ectopic DA expression in H. DA and PCV are indicated by brackets. Genotype is noted on the left, chemical treatments are indicated in respective panels. Embryos in J,K were treated with 30 µM SL327 from 25 to 29 hpf. (L,M) Quantification of endothelial cell number per ISV (L) and ISV length (M) in embryos of the indicated genotype and after chemical treatment as indicated. Embryos were treated with 15 µM SL327 from 20 to 34 hpf. (E,L,M) Numbers of cells and embryos used for analysis are shown. Error bars are ±s.d.; *P<0.05, **P<0.01, ***P<0.001. EXPRESSION / LABELING:
PHENOTYPE:
|

Activation of presumptive Vegfa downstream signaling effectors in zebrafish blood vessels. (A-E) Confocal images of wild type Tg(fli1a:egfp)y1 embryos at 24 hours post fertilization (hpf). Lateral views, anterior to the left, dorsal is up. Dorsal aorta (DA) and posterior cardinal vein (PCV) are indicated. Arrowheads indicate intersomitic vessels, arrows indicate DA endothelial cells, and yellow arrowheads denote PCV endothelial cells. (A'-E') Images from same embryos as in A-E, immuonstained with primary antibody against indicated epitope and secondary antibody conjugated to HRP followed by TSA-Cy3 amplification. (A''- E'') Overlay of images from Tg(fli1a:egfp)y1 expression and Cy3 fluorescence. EXPRESSION / LABELING:
|
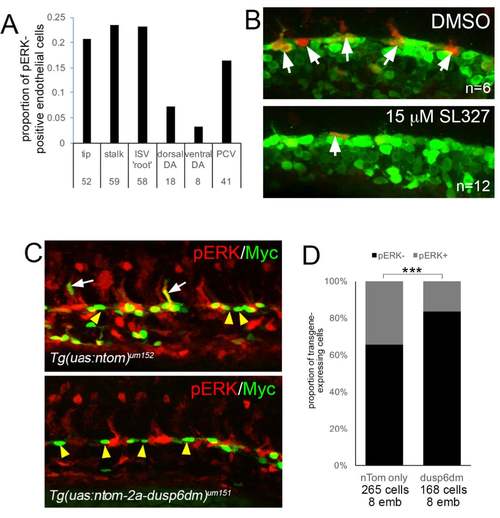
Chemical and genetic blockade of pERK in zebrafish embryos (A) Quantification of pERK-positive endothelial cells (i.e. also positive for fli1:egfp) in trunk vessels of wild type Tg(fli1a:egfp)y1 zebrafish embryos at 24 hpf. Graph shows average proportion of the total number of pERK-positive endothelial cells that contribute to indicated blood vessel. Numbers indicate total numbers of pERK-positive endothelial cells counted in 16 embryos. Hematopoietic cells, as identified by their round morphology, were not counted in this assessment. (B) pERK immunostaining of Tg(fli1a:egfp)y1 embryos following treatment for 30 minutes at 20 hpf with 0.1% DMSO or 15 μM SL327. Lateral views, anterior is left, dorsal is up. pERK-positive endothelial cells in the dorsal aorta are indicated by arrows. (C) Embryos bearing indicated transgenes at 21 hpf immunostained for pERK (red) and the nuclear localized Myc epitope (green) on tdTomato (nTom). White arrows denote co-staining of Myc and pERK, yellow arrows indicate Myc-positive;pERK-negative cells. (D) Quantification of pERK immunostaining in cells expressing indicated transgene. Number of cells and embryos used for analysis is indicated. ***p<0.001. |
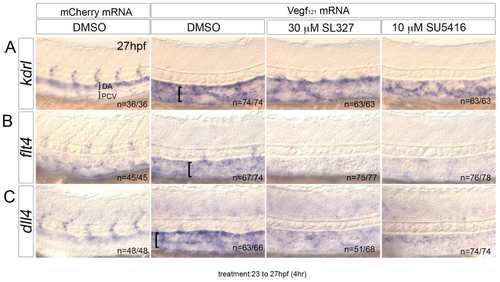
SL327 treatment blocks Vegfa-induced expansion of flt4 and dll4. (A-C) Whole mount in situ hybridization of embryos fixed at 27 hpf using riboprobes against (A) kdrl, (B) flt4, or (C) dll4. Embryos were injected with indicated mRNA encoding either mCherry or Vegfa121 followed by treatment from 23 to 27 hpf with the indicated compound. Numbers of embryos with representative phenotype are indicated in the lower right hand corner of each panel. Upper left panel, dorsal aorta (DA) and posterior cardinal vein (PCV) are indicated by brackets. Panels in second column, bracket denotes expanded expression of kdrl, flt4 and dll4 in both DA and PCV. |

Artery marker gene expression following ERK inhibition. (A) Expresion of efnb2a in embryos treated with indicated compounds from 17 hpf (15 somite stage) to 25 hpf. (B) Confocal images of embryos at 30 hpf bearing indicated transgenes. Myc staining of nTom cells is red and EphrinB2 is in green. Arrows denote dusp6dm-expressing cell expressing EphrinB2. The stained structure ventral to the dorsal aorta is the pronephric duct (pnd) (C-J) Whole mount in situ hybridization with indicated riboprobes. Chemical treatment is indicated at top, stage of treatment at right. Embryos were fixed immediately following treatment. Arrows indicate position of the dorsal aorta. |
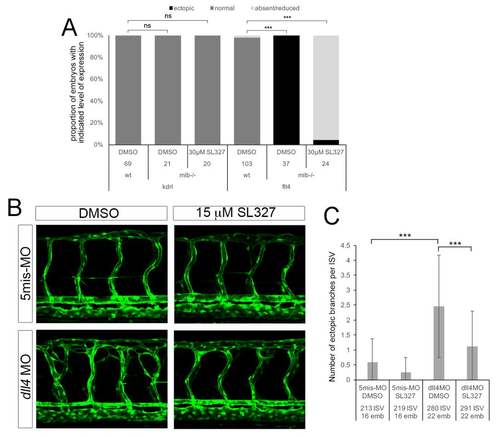
ERK inhibition normalized the hyper-angiogenic phenotype in Notch deficient embryos. (A) Proportion of embryos with expression level of indicated marker as determined by in situ hybridization. For flt4, “ectopic” denotes expression in the dorsal aorta, where it is normally absent. See panel Figure 7F-K for corresponding images. (B) Tg(kdrl:egfp)la116 embryos injected with 15 ng control (5misMO) or 15 ng dll4 MO. Embryos were treated from 48 hpf to 72 hpf with indicated compound. (C) Quantification of ectopic ISV branches in 5misMO- or dll4 MO-injected embryos treated with DMSO or 15 μM SL327 as in (A). Numbers of cells and embryos used for analysis are shown. Error bars are ±SD. ***p<0.001. EXPRESSION / LABELING:
PHENOTYPE:
|