
- Title
-
Vinculin b deficiency causes epicardial hyperplasia and coronary vessel disorganization in zebrafish
- Authors
- Cheng, F., Miao, L., Wu, Q., Gong, X., Xiong, J., Zhang, J.
- Source
- Full text @ Development

GFP is highly expressed in the ventricle of v12 zebrafish embryos. (A-D′) GFP is not detected in 75% epiboly embryos (A,A′), and is initially expressed in the somite boundaries at ~24 hpf (B). Cardiac GFP expression starts at ~35 hpf (C,C′) and GFP is highly expressed in the ventricle at 50 hpf (D,D'). Arrows indicate ventricle. (E-H) Ventricular GFP expression in v12 heterozygotes (E-F) and v12 homozygotes (G-H) at 84 hpf shown at high magnification. Arrows indicate ventricle. (I-I'') Immunostaining shows that β-catenin and GFP colocalize close to the cell membrane in v12 heterozygous hearts at 78 hpf. (J-J'') Immunostaining shows that GFP is absent from Z-disc (α-actinin) in v12 heterozygous hearts at 78 hpf. Scale bars: 100 µm in A-D,E-H; 20 µm in I; 5 µm in J. EXPRESSION / LABELING:
|

The vclb gene is disrupted in the v12 mutant. (A) The zebrafish vclb gene is a homolog of human vinculin (VCL). (B) vclb mRNA expression as revealed by in situ hybridization is similar to EGFP expression patterns in the somites at 24 hpf and the heart at 48 hpf. Arrow points to the heart. (C) vclb is an alternative transcript corresponding to the vcla transcript variant without exon 19. No other alternative splicing transcripts are detected. odc (ornithine decarboxylase 1) is a loading control. RT–, without reverse transcriptase. (D) Diagram indicating that the transposon insertion in the v12 mutant causes fusion of EGFP with the N-terminal 261 amino acids of Vclb (NVclb). (E) NVclb-EGFP fusion protein expression detected with a GFP antibody in heterozygous and homozygous v12 mutant heart at 30 dpf. Size markers (kDa) are shown to the right. Gapdh provides a loading control. (F,G) Intact vclb, but not vcla, mRNA expression is blocked in the v12 mutant at 36 hpf as assayed by RT-PCR (F) and qRT-PCR (G). The expression level of vcla is the same among wild type, heterozygotes and v12 mutant. The qRT-PCR data are presented as mean±s.e.m. Two-tailed unpaired t-test; NS, not significant; ***P<0.001. EXPRESSION / LABELING:
PHENOTYPE:
|

Overproliferation of Tcf21-positive epicardial-derived cells in v12 mutants. (A,B) Ventricular morphology (dorsal view) of the v12 mutant and a wild-type sibling at 30 dpf. Note the spherical ventricles in the v12 mutant (B) as compared with the pyramid-like heart in wild type (A). (C-F) Histology of the v12 mutant (D,F) and its wild-type sibling (C,E), showing the malformed heart and sub-epicardial hemorrhage (arrow) in the mutant. Epicardial cells (epi) change from wild-type squamous epithelium (E) to oval-shaped in the v12 mutant (F). (G,H) β-catenin immunostaining marks the cell membrane of epicardial cells. Cell size is reduced and the cell boundary is smoother in the mutant (H) compared with the wild-type sibling (G). (I,J) MF20 staining shows that the overproliferated cells in the sub-epicardium of the v12 mutant are negative for muscle-specific myosin heavy chain. (K-L') The overproliferated cells are positive for vimentin (a marker of mesenchymally derived cells) in the v12 mutant (L,L') compared with its control sibling (K,K'). Aldhla2 marks the epicardium. (M-N') Aldh1a2 colocalizes with Tg(tcf21:dsRed) transgenic reporter in the epicardial cells of the wild-type sibling at 30 dpf (M,M'). By contrast, both overproliferated cells in the sub-epicardium region and the outermost layer of epicardial cells are positive for DsRed staining. Only the outermost layer of epicardial cells shows strong Aldh1a2 staining in the mutant (N,N'). A, atrium; V, ventricle. Scale bars: 100 μm in A-D; 20 μm in E-N. EXPRESSION / LABELING:
PHENOTYPE:
|
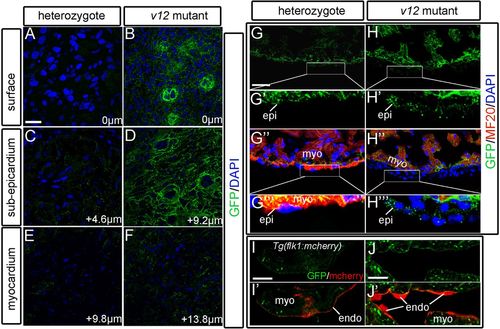
Ventricular expression patterns of the NVclb-EGFP fusion protein. (A,B) GFP expression in the ventricle surface (0 μm) at 52 dpf, showing the formation of plexus-like structures in the v12 mutant (B) compared with heterozygotes (A). (C,D) GFP expression patterns in the sub-epicardium of ventricles at 4.6 μm (C) and 9.2 μm (D) from the surface. Strong expression of GFP fusion protein is shown in the mutant (D) compared with heterozygotes (C). (E,F) GFP is detected at the boundary between endothelial cells and muscles of ventricles at 9.8 μm (E) and 13.8 μm (F) from the surface. (G-H''') GFP is ubiquitously expressed in the ventricle. GFP expression is detected in several layers of GFP+/MF20- epicardium-derived cells in the mutant (H'',H''') compared with a single layer of epicardial cells in heterozygotes (G'',G'''). (I-J′) Tg(flk1:mcherry) transgenic reporter is used to label endothelial cells. GFP is detected at the boundary between endothelial cells (red) and myocardium. endo, endocardium; epi, epicardium; myo, myocardium. Scale bars: 10 μm in A-F,I-J'; 20 μm in G,G'',H,H''. |

vclb deficiency causes disorganization of coronary vessels. The Tg(fli1a:EGFP) transgenic line (endothelial cells labeled by EGFP) is used to trace coronary vessel development. The Tg(tcf21:dsRed) transgenic line is used to label epicardial cells. (A-H) In wild-type hearts, coronary vessels first appear on the dorsal surface of the ventricle and are close to the atrium-ventricle connection at ~28 dpf. Coronary vessels then spread, extend, and wrap the entire ventricle wall from 35 to 55 dpf. Dorsal views (A-D) and ventral views (E-H) are shown. (I-P) In the v12 mutant, coronary vessels appear at the same place as in wild-type siblings, but more vessels are detected at the initial stages. Wild-type coronary vessels are well connected to each other, but the overproliferated mutant vessels remain isolated and disorganized. Dorsal views (I-L) and ventral views (M-P) are shown. (Q-R') In the v12 mutant, coronary vessels are surrounded by epicardial-derived cells (R,R') rather than by cardiac muscles as in the wild-type sibling (Q,Q') at 55 dpf. MF20 stains cardiac muscles. Arrows indicate vessels that are (Q,Q') or are not (R,R') in contact with cardiac muscle. (S-V'') At 40 dpf, Tg(fli1:EGFP)-labeled endothelial tubes in wild-type ventricles are well aligned with Tg(tcf21:dsRed)-labeled epicardial-derived perivascular cells (S,S',U-U''). By contrast, most of the endothelial tubes in v12 mutants are not well aligned with perivascular cells (T,T',V-V''). Note the overproliferated endothelial and perivascular cells in the mutant. Results are shown in whole-mount view (S-T') and cryosection (U-V''). Scale bars: 100 μm in A-P; 10 μm in Q-R′; 20 μm in S-V″. EXPRESSION / LABELING:
PHENOTYPE:
|

pERK and pFAK are upregulated in the epicardium and endocardium of v12 mutant ventricles. (A-B') pErk1/2 expression (green) is increased in the endocardium of v12 mutants at 55 dpf compared with wild-type sibling. (C-D') pErk1/2 expression is increased in the epicardium and endocardium of v12 mutant at 15 dpf. MF20 staining (red) indicates cardiac muscles. (E-F') Tg(tcf21:dsRed) transgenic reporter indicates epicardium. Upregulated pErk1/2 colocalizes with RFP signal. (G) Co-immunoprecipitation shows that NVclb-EGFP is not associated with paxillin, which normally interacts with wild-type Vclb, when ectopically expressed in HEK293 cells. IP, immunoprecipitation; WB, western blot. Size markers (kDa) are shown to the left. (H-I') The localization of paxillin at the boundary between epicardium and myocardium is partially lost in the v12 mutant (L,L') compared with wild-type siblings (H,H'). (J-M) pFAK(Y576/577) expression is upregulated whereas total FAK expression remains unchanged in the epicardium and endocardium of the v12 mutant at 45 dpf (L,M) compared with wild-type sibling (J,K). Scale bars: 20 μm. EXPRESSION / LABELING:
PHENOTYPE:
|

Vcla expression may alleviate defects in myocardium in the v12 mutant. (A) The monoclonal anti-VCL antibody fails to recognize the NVclb-EGFP fusion protein and C-terminal Vclb but recognizes Vclb (aa227-1065) (left panel). All three Vclb variants can be detected by anti-FLAG antibody (right panel). The anti-VCL antibody recognizes the middle region of Vclb, which is absent from NVclb-EGFP, and recognizes Vcla protein (aa227-837), indicating that the VCL antibody only recognizes Vcla protein in v12 mutants. Arrow points to the endogenous VCL protein of HEK293 cells. (B-B''') Immunostaining reveals that NVclb-EGFP colocalizes with Aldh1a2 in epicardial cells in v12 mutant ventricles at 50 dpf. (C-C''') Immunostaining shows that Vcla is mainly expressed in the myocardium but not in epicardial cells in v12 mutant ventricles at 50 dpf. EXPRESSION / LABELING:
|
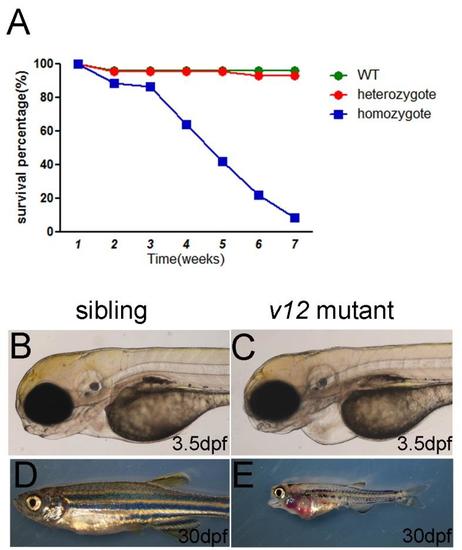
Survival curve and defects of v12 mutant. (A) Survival curve of v12 mutant and its siblings. (B-C) Pericardiac edema in v12 mutant at 3.5 dpf (D-E) v12 mutant exhibitscraniofacial defects and pleural effusion compared with sibling at 30 dpf. PHENOTYPE:
|

Vclbdel17 mutant exhibits the same phenotype as v12 mutant. (A) In vclbdel17 mutants, a17-bp deletion in vclb gene was created using CRISPR/Cas9 technology. The deletion removes a BglII site in vclb gene used for genotyping. (B) At 3dpf, vclbdel17 mutant shows similar pericardiac edema and pleural effusion in v12 mutant. (C) At 30 dpf, vclbdel17 mutant has craniofacial defects resembling v12 mutant. (D-G) vclbdel17 mutant shows increased epicardial expansion and Aldh1a2 expression at 40 dpf (E)and up-regulation of pERKin the endocardium at 55 dpf(G), both are similar to v12 mutant. Wildtype sibling controls are shown at the same stages (D, F). MF20 labels cardiomyocytes and DAPI labels nuclei. (H-M) vclbdel17 mutant shares similar coronary vessel defects with v12 mutant as indicated with a Tg(fli1a:EGFP) transgenic reporter, which labels endothelial cells. (N-N',O-O') Tg(tcf21:dsRed) transgenic reporter, which labels epicardial cells. vclbdel17 mutant shows similar over-proliferation of epicardial derived cells in v12 mutant. Scale bar:20μm(D-G, L-O'), 100μm(H-K). |

Cardiac progenitor specification and early ventricular development are relatively normal in v12 mutants. (A-D) vclb mRNA is greatly reduced in the mutants at 30 hpf revealed by whole mount in situ hybridization(B), particular in the heart at 48 hpf (D) compared with wildtype siblings (A, C).Arrow points to the heart (C). (E-H) Cardiac progenitor markers cmlc2 and nkx2.5 are not affected in v12 mutants(F, H) compared with wildtype siblings (E, G) at early heart-tube formation stages. (I-P) Ventricular markers vmhc and nppa are not affected in v12 mutants (J, N, L, P) compared with wildtype siblings (I, K, M, O) from 36 to 84 hpf. |

Early development of endocardial and epicardial cells is relatively normal in v12 mutants. (A-D, A'-D') Endocardial cells are labeled by Tg(flk1:mcherry) transgenic reporter. The endocardial cells are aligned in the inner face of heart chamber both in siblings and v12 mutants. (E-H) The epicardial progenitor marker gene tbx18 exhibits similar expression level between siblings and v12 mutants(arrows point to tbx18 expression).E,G, ventral view; F,H, lateral view. Scale bar: 20μm |
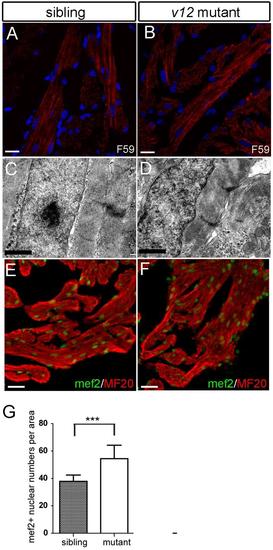
Cardiac muscle sarcomere structure is relatively normal in v12 mutant. (A-B) Sarcomere structure is shown by staining with a F59 antibody recognizing myosin heavy chain. v12 mutant shows a relatively normal sarcomere structure. (C-D) Transmission electron microscope (TEM) images show relatively normal sarcomere structures in v12 mutant. Note some gaps between muscle cells. (E-F) Immunostaining usingmef2 and MF20 antibodies aimedto quantify density of cardiomyocytes in v12 mutant and wild-typed sibling. (G) Myocardial density is measured by mef2 and MF20 antibody immunostaining.v12 mutant has more mef2 positive nucleiper 1000 μm2 than the wild type sibling.Data are presented as mean ± s.e.m.two-tailed unpaired t-test, ***, P<0.001. Scale bar: 10μm(A-B), 1μm(C-D), 20μm(E-F). |

Hemoglobin staining with O-diansidine shows hemorrhage in sub-epicaridium of v12 mutant. Sub-epicaridium hemorrhage (brown O-diansidine staining) detected in some v12 mutants (B-B') compared with isolated heart staining in the wild-type sibling (A-A').Scale bars:100μm (A-B), 20μm(A'-B'). |
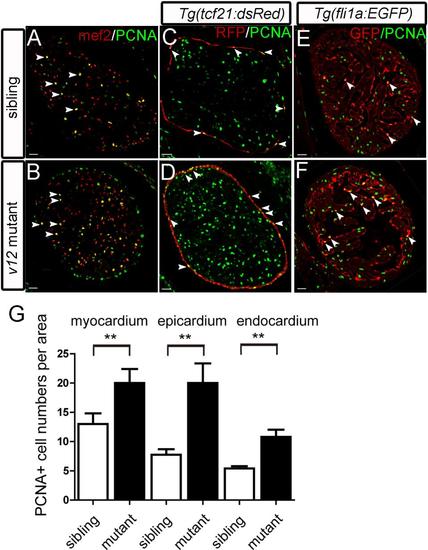
Epicardial over-proliferation is prominent in v12 mutant. (A-B) Mef2 and PCNA immunostaining images show that increased proliferating cells in the v12 mutant myocardium. (C-D) Epicardial cells is labeled by Tg(tcf21:dsRed) transgenic reporter. Increased PCNA positive cells found in the epicardium region. (E-F) Increased proliferative cells in the endocardium of v12 mutant labeled by Tg(fli1a:EGFP) transgenic reporter. (G) v12mutant has more PCNA positive nuclei per 105μm2 than the wild type sibling. Data are presented as mean±s.e.m.two-tailed unpaired t-test, **, P<0.01. Scale bar: 20μm. EXPRESSION / LABELING:
PHENOTYPE:
|

The intensity of fli1a-EGFP signal is much stronger than that of NVclb-EGFP. Coronary endothelial cells labeled with fli1a-EGFP in vclb heterozygotes (A) and vclb mutants (B). EGFP intensity of fli1a-EGFP (arrowheads) is much stronger than that of epicardial NVclb-EGFP (arrows). Scale bar: 20μm. |

Coronary vessel density increases in v12 mutant. (A-D) MEK inhibitor (U0126, 10μM) treatment cause partial decrease of the expression level of pERK1/2 in sibling and v12 mutant at 15 dpf. (E) Blood vessel density is presented as percentage of endothelial cell(EC)covered area in a randomly selected area(200µmx 200 µ m).The Tg(fli1a:EGFP) transgenic reporter isused to label endothelial cells. At 40 dpf, blood vessel density is measured in siblings and v12 mutant. v12 mutant has higher blood vessel density than the sibling. MEK inhibitor (U0126, 10μM) treatment impairs coronary development and reduces blood vessel density in wild type, but not in the mutant. |

Coronary vessels are largely disconnected in the v12 mutant at 50 dpf. Whole mount O-diansidine staining ofhearts at 50 dpf. (A) Blood cells continuously fill well-organized coronary vessels of a wild type heart. (B) Some blood cells enter into a few large coronary vessels in a v12 mutant heart. Disconnected blood vessels are obvious. PHENOTYPE:
|

Hypoxia related genes are not up-regulated in v12 mutant heart at 15 dpf (A-B) In situ hybridization with hypoxia inducible factor 1a (hif1a) RNA shows similar expression between sibling and v12 mutant hearts. (C-D) Images of in situ hybridization with the sense probe. (E) Quantitative PCR results of egln3(phd3) shows similar RNA expression level between sibling and v12 mutant hearts. Scale bar: 20μm. |
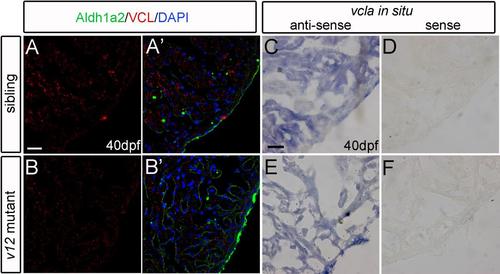
Vcla is not up-regulated in v12 mutant heart. (A-B') VCL immunostaining signal intensity is similar between wild type and v12 mutant heart sections at 40 dpf. (C-F) vcla RNA (in situ hybridization of cryosections) is not up-regulated in v12 mutant compared to that in wild type at 40 dpf (C.E). vcla sense probe used as the negative control (D,F). Scale bar: 20μm. |