
- Title
-
Inhibition of vascular endothelial growth factor signaling facilitates liver repair from acute ethanol-induced injury in zebrafish
- Authors
- Zhang, C., Ellis, J.L., Yin, C.
- Source
- Full text @ Dis. Model. Mech.
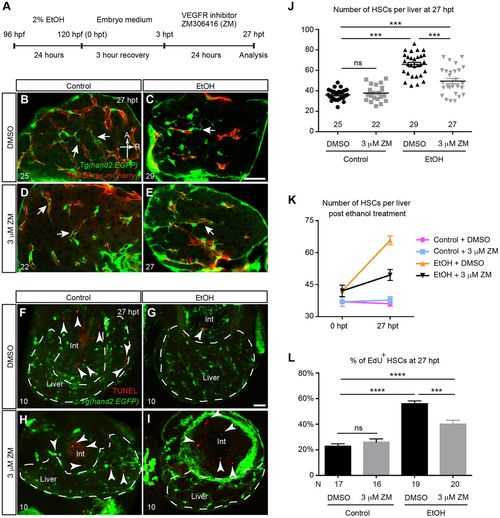
VEGFR inhibition suppressed the increase of HSC cell number post-acute ethanol exposure. (A) Work flow of the ethanol and VEGF receptor (VEGFR) inhibitor treatment. (B-E) Representative confocal single-plane images of Tg(hand2:EGFP;kdrl:ras-mCherry) larvae treated with 0.03% DMSO (B), 2% ethanol followed by DMSO (C), 3 μM VEGFR inhibitor ZM (D), and 2% ethanol followed by 3 μM ZM (E) at 27 h post-ethanol treatment (hpt). The HSCs are labeled by Tg(hand2:EGFP) expression (green), and the endothelial cells are marked by Tg(kdrl:ras-mCherry) expression (red). Arrows point to the cellular processes of HSCs. Ventral view, anterior is to the top. Sample sizes are indicated. A, anterior; R, right. Scale bar: 50 μm. (F-I) Confocal three-dimensional projections of vibratome transverse sections stained by TUNEL assay. The apoptotic cells are shown in red (arrowheads), and the HSCs are labeled by Tg(hand2:EGFP) expression (green). Very few apoptotic cells were present in the livers of all the control and experimental groups, but were frequently seen in the intestine (int). For each group, three liver sections per larva from 10 larvae were analyzed. Dashed line marks the liver. Scale bar: 30 μm. (J) Numbers (mean±s.e.m.) of HSCs per liver in each treatment group at 27 hpt. (K) Changes in the numbers (mean±s.e.m.) of HSCs per liver in each treatment group between 0 and 27 hpt. The numbers of animals analyzed are indicated in J and Fig. S1F. (L) Percentages (mean±s.e.m.) of HSCs that incorporated EdU labeling in each treatment group. (J-L) Each experiment was repeated at least three times and the numbers of animals analyzed are shown. Statistical significance in J was calculated by one-way ANOVA and Tukey's post-hoc test; in L it was determined by two-tailed Student's t-test. ***P<0.001; ****P<0.0001; ns, not significant. |

VEGFR inhibition attenuated fibrogenic responses post-acute ethanol treatment. (A-D″) Confocal single-plane images from the vibratome transverse sections showing that ZM treatment after acute ethanol exposure suppressed laminin deposition. (A-D) HSCs marked by Tg(hand2:EGFP) expression; (A′-D′) laminin deposition; and (A″-D″) merged images of the two. Dashed line marks the liver. Scale bar: 20 μm. Ten larvae were examined in each experimental group. Arrowheads in B-B″ point to the HSCs that secreted laminin. Int, intestine. (E) qPCR analyses showing the comparison of col1a1b, lamb1a, tgfb1a, and acta2 expression in control and ethanol-treated livers at 0 and 27 hpt. (F-I) qPCR analyses showing the comparison of col1a1b (F), lamb1a (G), tgfb1a (H), and acta2 (I) expression in the livers of larvae treated with DMSO, ZM, ethanol followed by DMSO, and ethanol followed by ZM at 27 hpt. (E-I) Triplicates were performed. The results are represented as relative expression levels that are normalized to the housekeeping gene eef1a1l1 (mean±s.e.m.). Statistical significance was calculated by one-way ANOVA and Tukey's post-hoc test. *P<0.05; **P<0.01; ***P<0.001; ns, not significant. |
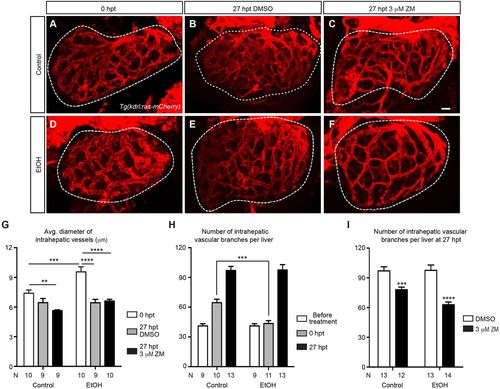
VEGFR inhibition suppressed hepatic angiogenesis that intensified after acute ethanol treatment. (A-F) Confocal three-dimensional projections of the whole liver in the control and ethanol-injured larvae immediately after ethanol treatment (0 hpt) (A,D), and after 3 h of recovery period plus 24 h of subsequent DMSO or ZM treatment (27 hpt) (B,C,E,F). The intrahepatic vasculature is marked by Tg(kdrl:ras-mCherry) expression. Ventral view, anterior is to the top. Dashed line outlines the liver. Scale bar: 30 μm. (G) Average diameter of intrahepatic vessels (mean±s.e.m.) in control and ethanol-treated livers with or without subsequent ZM treatment. (H) Numbers (mean±s.e.m.) of intrahepatic vascular branches per liver before ethanol treatment, immediately after ethanol treatment (0 hpt) and at 27 h after ethanol treatment (27 hpt). (I) Numbers (mean±s.e.m.) of intrahepatic vascular branches per liver in the larvae treated with DMSO alone, ZM alone, ethanol followed by DMSO, and ethanol followed by ZM, at 27 hpt. (G-I) Each experiment was repeated three times and the numbers of animals analyzed are shown. Statistical significance in G was calculated by one-way ANOVA and Tukey's post-hoc test, and in H,I by two-tailed Student's t-test. **P<0.01; ***P<0.001; ****P<0.0001. |
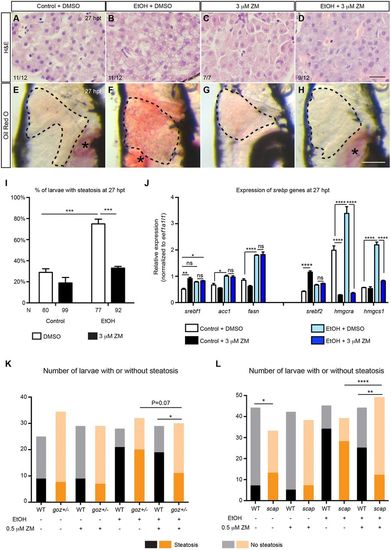
VEGFR inhibition ameliorated hepatic steatosis post-acute ethanol treatment. (A-D) Hematoxylin and eosin (H&E) staining of paraffin sections showing livers treated with DMSO alone, ZM alone, ethanol followed by DMSO, and ethanol followed by ZM, at 27 hpt. The total numbers of livers examined and the numbers of livers that exhibited the representative phenotypes are indicated. Scale bar: 20 μm. (E-H) Representative images of the whole-mount Oil Red O staining in different experimental groups. Dashed line marks the liver. Lateral view, anterior is to the top. Oil Red O also stains the residual yolk tissue and swim bladder (asterisks). Scale bar: 250 μm. (I) Percentages (mean±s.e.m.) of the larvae with hepatic steatosis in different experimental groups at 27 hpt based on Oil Red O staining. The experiments were repeated four times and the number of animals analyzed is listed in each column. (J) qPCR analyses showing the hepatic expression of srebf1 genes (left) and srebf2 genes (right) in different experimental groups at 27 hpt. Triplicates were performed. The results are represented as relative expression levels that are normalized to the housekeeping gene eef1a1l1 (mean±s.e.m.). (K) The numbers of WT or goz+/− mutant larvae that developed steatosis at 27 hpt with or without being treated with 0.5 μM ZM. (L) The numbers of control or scap morpholino-injected larvae that developed steatosis at 27 hpt with or without being treated with 0.5 μM ZM. Statistical significance in I was calculated by two-tailed Student's t-test, and in J by one-way ANOVA and Tukey's post-hoc test. In K,L analysis of differences in the distribution of phenotypes was performed by the contingency table Fisher's exact test. *P<0.05; **P<0.01; ***P<0.001; ****P<0.0001; ns, not significant. |
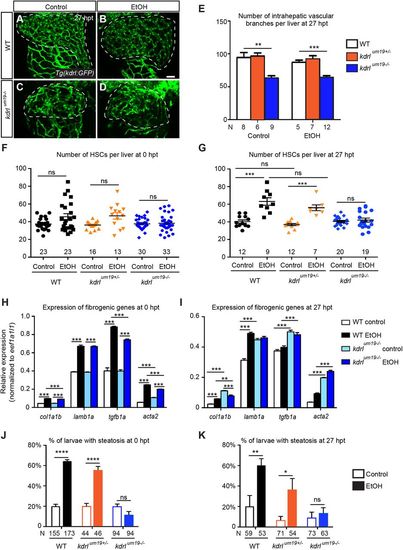
kdrl mutants developed similar hepatic injuries after acute ethanol treatment as the ZM-treated WT larvae. (A-D) Confocal three-dimensional projections showing the whole-liver intrahepatic vasculature in WT and kdrlum19 mutant larvae at 27 hpt. The intrahepatic vasculature is marked by Tg(kdrl:GFP) expression. Ventral view, anterior is to the top. Dashed line marks the liver. Scale bar: 40 μm. (E) Numbers (mean±s.e.m.) of intrahepatic vascular branches per liver in WT, kdrl heterozygotes and homozygous mutants at 27 hpt. (F,G) Numbers (mean±s.e.m.) of HSCs in WT, heterozygotes and mutants in different experimental groups at 0 hpt (F) and 27 hpt (G). (H,I) qPCR analyses showing the comparison of col1a1b, lamb1a, tgfb1a and acta2 expression in control and ethanol-treated WT and mutant livers at 0 and 27 hpt. Triplicates were performed. The results are represented as relative expression levels normalized to the housekeeping gene eef1a1l1 (mean±s.e.m.). (J,K) Percentages (mean±s.e.m.) of WT (black), kdrl heterozygotes (orange) and homozygous mutants (blue) with hepatic steatosis at 0 hpt (J) and 27 hpt (K) based on Oil Red O staining. Each experiment in E-G was repeated three times and the numbers of larvae analyzed are shown. Statistical significance in E,J,K was calculated by two-tailed Student's t-test, and in F-I by one-way ANOVA and Tukey's post-hoc test. *P<0.05; **P<0.01; ***P<0.001; ****P<0.0001; ns, not significant. |

ZFIN is incorporating published figure images and captions as part of an ongoing project. Figures from some publications have not yet been curated, or are not available for display because of copyright restrictions. |

Ethanol-induced fibrogenesis and steatosis could be uncoupled from angiogenesis. (A) Numbers (mean±s.e.m.) of intrahepatic vascular branches per liver at 27 hpt in uninjured WT larvae treated with DMSO, uninjured larvae treated with 2 μM ZM, ethanol-exposed larvae treated with DMSO, and ethanol-exposed larvae treated with 2 μM ZM. (B) Percentages (mean±s.e.m.) of animals in different experimental groups with hepatic steatosis at 27 hpt based on Oil Red O staining. (C) Numbers (mean±s.e.m.) of HSCs per liver in different experimental groups at 27 hpt. (D-G″) Confocal single-plane images from the vibratome transverse sections showing that ZM treatment after acute ethanol exposure suppressed laminin deposition in cloche mutants. (D-G) HSCs marked by Tg(hand2:EGFP) expression; (D′-G′) laminin deposition; and (D″-G″) merged images of the two. Ventral views, anterior is to the top. Dashed line marks the liver. Scale bar: 30 μm. Ten larvae were examined in each experimental group. Arrowheads mark the HSCs that secreted laminin. (H) Percentages (mean±s.e.m.) of WT plus cloche heterozygotes, and homozygous cloche mutants treated with ethanol followed by ZM that exhibited hepatic steatosis at 27 hpt based on Oil Red O staining. Statistical significance in A,B,H was calculated by two-tailed Student's t-test, and in C one-way ANOVA and Tukey's post-hoc test. *P<0.05; **P<0.01; ***P<0.001; ****P<0.0001; ns, not significant. |

Treatment with VEGFR inhibitor during acute ethanol exposure did not alter the cellular responses of hepatic stellate cells (HSCs) to ethanol. (A) Work flow of the ethanol and VEGF receptor (VEGFR) inhibitor co-treatment experiment. (B-E) Confocal single plane images of Tg(hand2:EGFP;kdrl:ras-mCherry) larvae treated with 0.03% DMSO (A), 2% ethanol and DMSO (B), 3 μM ZM306416 (ZM) (C), 2% ethanol and 3 μM ZM (D) from 96 to 120 hpf. The HSCs are labeled by Tg(hand2:EGFP) expression (green), and the endothelial cells are marked by Tg(kdrl:ras-mCherry) expression (red). Ventral view, anterior is to the top. Scale bar, 30 μm. (F) Numbers (mean±s.e.m.) of HSCs per liver in each treatment group. Three separate experiments were performed and the total numbers of animals analyzed are shown. One-way ANOVA and Tukey’s post-hoc test indicated that there is no statistical difference among each group (p>0.05). |

Larvae that were co-treated with VEGFR inhibitor and ethanol from 96 to 120 hpf still exhibited laminin deposition in the liver. (A-D) show HSCs marked by Tg(hand2:EGFP) expression; (A'-D') show laminin deposition; (A''-D'') are the merged images of the two. (A-D'') Confocal single plane images from the vibratome transverse sections are shown. 10 larvae were examined in each experimental group. Dashed line marks the liver. Scale bar, 20 μm. Int, intestine. |
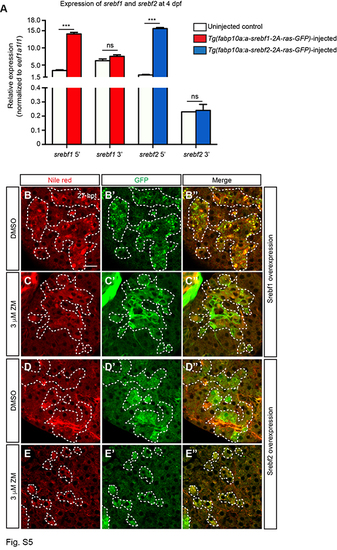
VEGFR inhibition did not suppress the accumulation of lipids that was induced by Srebf1 and Srebf2 overexpression. (A) qPCR analyses showing the hepatic expression of Srebf1 and Srebf2 in the livers from animals injected with active Srebf1 or 2 constructs, and from the uninjected controls. We designed two sets of PCR primers. srebf1 5' and srebf2 5' primers recognize sequences near the 5' end of the open reading frame of the corresponding genes, thus targeting both the mRNAs encoding the active forms of Srebf1 and Srebf2, and the endogenous srebf1 and srebf2 mRNAs, respectively. srebf1 3' and srebf2 3' primers recognize sequences near the 3' end of the open reading frame, thus are specific for the endogenous srebf1 and srebf2 mRNAs. The expression levels of the endogenous srebf1 and srebf2 mRNAs are comparable between uninjected control and injected animals. By contrast, the livers from the injected animals showed significantly higher expression of srebf1 5' and srebf2 5' sequences than the livers from the uninjected control, indicating that they overexpressed the transgene containing the coding sequence for the active form of either protein. Triplicates were performed. The results are represented as relative expression levels that are normalized to the house keeping gene eef1a1l1 (mean±s.e.m.). Statistical significance was calculated by one-way ANOVA and Tukey's post-hoc test. ***, p<0.001; ns, not significant. (B-E'') Confocal single plane images showing Nile red staining for lipid droplets (B-E), GFP for visualizing hepatocytes that had incorporated the transgene (B'-E'), and merged images of the two (B''-E''). Injection of the constructs resulted in mosaic expression of the transgene in the hepatocytes. In DMSO-treated controls (B-B'', D-D''), the hepatocytes that overexpressed active Srebf1 or Srebf2 as indicated by GFP labeling exhibited lipid droplets deposition, whereas the hepatocytes that did not express either transgene and thus were GFP-negative did not contain lipid droplets. Interestingly, the hepatocytes that overexpressed active Srebf1 contained large droplets and the hepatocytes that overexpressed active Srebf2 contained small droplets. Treatment of ZM did not block the formation of lipid droplets caused by Srebf1 or Srebf2 overexpression (C-C'', E-E''). Given that ZM decreased the expression of Srebf2 target genes, our results suggest that Srebf signaling may act downstream of VEGFR to regulate acute ethanol-induced hepatic steatosis. (B-E'') Dashed lines outline the hepatocytes that had incorporated the transgene. Scale bar, 20 μm. 5 larvae were imaged for each experimental condition. |

Confirmation of the purity of the FACS-sorted HSC, endothelial cells, and parenchymal cell population. (A) qPCR analyses show that in WT larval livers that were not treated with ethanol, the expression of kdrl was 9.8-fold higher in the FACS-sorted endothelial cells than in the FACS-sorted HSCs at 0 hpt. In the ethanol-treated larvae, the expression of kdrl was 1.7-fold higher in the endothelial cells than in the HSCs. (B) The hepatic stellate cell marker foxf1 (Yin et al., 2012) was only expressed in the Tg(hand2:EGFP)-positive cells in both control and ethanol-treated samples. (C) In both control and ethanol-treated samples, the endothelial cell marker cdh5/VE-cadherin was enriched in Tg(kdrl:ras-mCherry)-positive cells. Its expression was significantly lower in the Tg(hand2:EGFP)-positive cells and absent in the cells that did not express either transgene. (A-C) Triplicates were performed. The results are represented as relative expression levels that are normalized to the house keeping gene eef1a1l1 (mean±s.e.m.). (D-G'') Confocal images showing the comparison of the expression of Tg(-2.3etv2:etv2- EGFP) transgene that marks endothelial cells and their progenitors (D-G) (Schupp et al., 2014) and the expression of Tg(kdrl:ras-mCherry) that marks endothelial cells but not endothelial progenitors (D'-G'). (D''-G'') are the merged images of the two. (D-E'') show control livers at 0 hpt and (F-G'') show ethanol-injured livers at 0 hpt. (D-D'' and F-F'') are confocal three-dimensional projections. (E-E'' and (G-G'') are confocal single plane images. The expression of Tg(-2.3etv2:etv2-EGFP) completely overlapped with the expression of Tg(kdrl:ras-mCherry) in both control and ethanol-treated livers. We did not detect any hepatic cells that were positive for Tg(-2.3etv2:etv2-EGFP) expression but negative for Tg(kdrl:ras-mCherry), which would indicate that they were progenitors. Taking together, it is unlikely that the FACS-sorted HSC population is contaminated by endothelial progenitors that do not express VE-Cadherin. (D-G'') Ventral views, anterior is to the top. Scale bar, 20 μm. 10 larvae were analyzed for each experimental condition. |

Few macrophages and neutrophils were recruited to the liver after acute ethanol treatment. (A-D) Confocal three-dimensional projections showing Tg(lyz:GFP)- expressing neutrophils (green) in the whole liver at 27 hpt. (E) Numbers (mean±s.e.m.) of neutrophils per liver at immediately after the ethanol treatment (0 hpt, left) and 27 hpt (right). Only one or two neutrophils were detected in the livers in all experimental groups at both time points. (F-I) Confocal three-dimensional projections showing Tg(mpeg1:YFP)-expressing macrophages (green) in the whole liver at 27 hpt. (J) Numbers (mean±s.e.m.) of macrophages per liver at 0 hpt (left) and 27 hpt (right). (A-D, F-I) Phalloidin staining (red) that labels cell cortex is used for recognizing various organs. Ventral views, anterior is to the top. Dashed line marks the liver. Scale bar, 30 μm. (E, J) Statistical significance was calculated by one-way ANOVA and Tukey’s posthoc test. **, p<0.01, ns, not significant. |