
- Title
-
Embryonic Ethanol Exposure Dysregulates BMP and Notch Signaling, Leading to Persistent Atrio-Ventricular Valve Defects in Zebrafish
- Authors
- Sarmah, S., Muralidharan, P., Marrs, J.A.
- Source
- Full text @ PLoS One

Embryonic ethanol exposure led to defective AV valve formation in zebrafish. (A-D′) Hematoxylin and eosin stained coronal sections of 4 dpf zebrafish hearts showed two layers of valve forming cells confined at the AVC in control embryos (A, A′); unorganized clusters of cells at the AV boundary in E100 ethanol treated embryos (B, B′); rows of cells at the extended AVC in E100 ethanol treated embryos (C, C′); and unorganized clusters of cells at the AV boundary in E150 ethanol treated embryos (D, D′). High magnification images of the boxed areas (A′-D′). (E-M) SPIM imaging of beating hearts of Tg(fli1:EGFP) embryos showed completely filled atrium (E, H, K) and ventricular (G, J, M) chambers before ejection of blood in control (E, G) and ethanol treated embryos (H, J, K, M). (F) Control beating heart at the relaxed state showed valve leaflets at the superior and inferior aspects of AVC (F; arrowheads). Ethanol treated embryos showed long valve forming cells extending into the ventricle chamber (E100 ethanol, I) or no valve forming cells at the AVC in E150 treated embryos (L). EXPRESSION / LABELING:
|
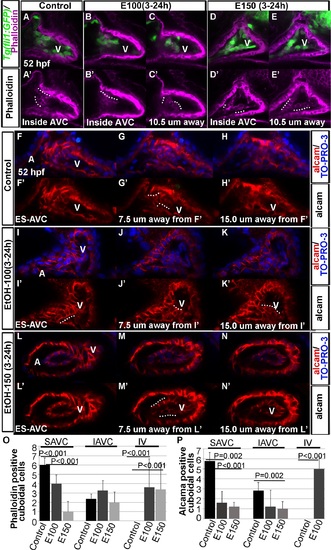
Ethanol-exposure reduced precursors of valves at the AVC and produced ectopic valve-like cells in the ventricular endocardial lining. (A-E′) Confocal sections of phalloidin stained Tg(fli1:EGFP) embryos showed differentiated cuboidal valve precursors inside AVC in control embryos (A, A′); E100 ethanol treated embryos showed phalloidin stained cuboidal cells inside AVC (B, B′) and inside the ventricle (10.5 µM away from the section B; C, C′); E150 ethanol treated embryos showed fewer phalloidin stained cuboidal cells at the AVC (D, D′) but more cells inside the ventricle (10.5 µM away from the section D; E, E′). White dotted lines show the rows of cuboidal cells. (F-N′) Confocal sections of anti-Alcama antibody stained embryos showing Alcama expression in the endocardial cells at the surface of the endocardium at AVC (F, F′, I, I′, L, L′), 7.5 µM (G, G′, J, J′, M, M′) and 15.0 µM away from surface endocardial cell sections (H, H′, K, K′, N, N′) in control and ethanol-exposed embryos. Control embryos showed Alcama positive cuboidal cells at 7.5 µM away from the surface AVC endocardium (G, G′); ethanol-exposed embryos showed Alcama positive cuboidal cells at the surface of AVC endocardium (I, I′) as well as 7.5 µM and 15 µM away from the AVC (J-K′, M-M′). White dotted lines show rows of cuboidal cells. A: Atrium, V: Ventricle, ES-AVC: Endocardial cells at the surface of AVC. (O, P) Graphs depict the number of phalloidin positive (O) and Alcama positive (P) cuboidal cells at the superior (SAVC) and inferior (IAVC) aspects of AVC, and inside the ventricle (IV) in control and ethanol-treated embryos. Statistically significant P values are shown in the graphs. |

Late-staged zebrafish larvae exposed to ethanol during embryogenesis exhibited defective valve leaflets. (A-C) Masson′s trichrome stained coronal heart sections of 18 dpf larvae showed short and curved valve leaflets in control larvae (A), and longer and straight valve leaflets in larvae exposed to ethanol during embryogenesis (B, C). Black arrows: valve leaflets. (D-R) Single optical sagittal section of the heart of phalloidin stained Tg(kdrl:EGFP) larvae showed short AV valve leaflets in control larvae (D-F) and long valve leaflets in ethanol exposed larvae (I-K, N-P). White arrows: valve leaflets. 3D-rendering of the confocal sections showed narrow valve leaflets in the control (G, H) and thickened valve leaflets in ethanol exposed larvae (L, M, Q, R). White dotted lines demarcate valve leaflets. (S-U′) 3D-rendering of the optical sections at the AV junction of WGA labeled larvae showed two valve cusps in control larvae (S, S′) and deformed valve cusps in ethanol-exposed larvae (T-U′); S (54 µM thick), T (79.38 µM thick), U: 3D (81.9 µM thick) show the rendering of total number of Z sections. S′, T′, U′: 3D-rendering of same number of Z sections (25.2 µM thick). MS: Masson′s trichrome, Arrowhead: valve cusps. EXPRESSION / LABELING:
PHENOTYPE:
|

Juvenile fish exposed to ethanol during embryonic development exhibited defective valves. (A-I) Phalloidin stained Tg(kdrl:EGFP) fish showed two bigger valve cusps at the superior and inferior position, and two smaller leaflets oriented left and right of the AV orifice in control fish at 35 dpf (A-C); ethanol-exposed fish showed four smaller and irregular-shaped valve cusps (D-I). Arrows: smaller cusps. (J-R) WGA stained 2 months old Tg(kdrl:EGFP) fish exposed to ethanol during embryonic development showed four well-organized nicely-shaped valve cusps in control fish (J-L) and smaller, malformed valves in ethanol exposed fish (M-R). Arrowheads point to the holes between valve cusps; star demarcates the region strongly labeled by WGA at the AV orifice. (S-T′) Scanning electron microscopy of two months old fish showed four valve cusps in control fish (S-S′) and three smaller valve leaflets in ethanol treated fish (T, T′). S′ and T′: high magnification views of S and T; "?" point to the region of the possible fourth cusp. EXPRESSION / LABELING:
PHENOTYPE:
|
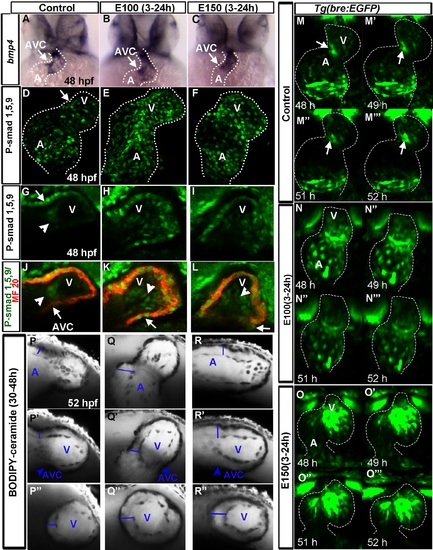
Ethanol exposure led to the failure of suppression of Bmp activity from the chamber cells during valvulogenesis. (A-C) In situ hybridization detecting bmp4 expression showed restricted expression at the AV boundary and outflow tract in control embryo (A) and widely distributed throughout the ventricle in ethanol treated embryos (B, C). (D-F) 3D reconstruction of confocal sections of phospho-Smad-1/5/9 immunostained embryos showed Bmp responsive phospho-Smad-1/5/9 positive cardiomyocytes at the base of the atrium, near AVC and inner curvature of the ventricle (white arrow) in the control embryo (D); phospho-Smad-1/5/9 positive cardiomyocytes were seen throughout the venricle in ethanol exposed embryos. Note: Please see S1 Fig for high magnification images. (G-L) Single Z-sections of phospho Smad-1/5/9 and MF20 (cardiac myosin) double immunostained embryos at the AV boundary showed phospho-Smad-1/5/9 positive endocardial cells at AVC in the control embryos (G, J) and throughout the entire ventricular endocardium in ethanol exposed embryos (H, I, K, L). Arrowheads: phospho-Smad-1/5/9 positive endocardial cells, Arrows: AVC myocardium. Note phospho-Smad-1/5/9 positive myocardial cells at the AVC towards the inner curvature of the ventricle in control embryo (G; arrow) and all ventricular myocardial cells in ethanol-exposed embryos (H, I). (M-O′′) Time lapse images of Tg(bre:EGFP) embryos from 48-52 hpf showed progressive loss of GFP signal from chamber cardiomyocytes, and strong GFP signal at the AV canal towards the inner curvature (arrow) and at the base of the atrium in control embryos (M-M′′′); GFP signal was less suppressed from the chamber cardiomyocytes in E100 ethanol exposed embryos (N-N′′′) and not suppressed in E150 ethanol exposed embryos (O-O′′′). (P-R′′) BODIPY-ceramide labeled embryos showed expansion of cardiac jelly (blue line) region between myocardium and endocardium in the atrium (P-R), AVC (P′-R′) and in the ventricle (P′′-R′′) in ethanol-exposed embryos (Q-R′′) compared to control (P-P′′). A: atrium, V: ventricle. White dotted line demarcates the heart. |

Ethanol exposure reduced Bmp activity during heart tube morphogenesis, and later during valvulogenesis, those embryos lost regionalization of Bmp activity at the AVC. (A-B′′) Tg(bre:EGFP) embryos showed reduced GFP label in the cardiac primordia in ethanol exposed embryos (A′-B′′) relative to control (A, B) at 16 somite (16s; 17 hpf; A-A′′) and heart cone stage (20 hpf; B-B′′). Arrowheads: cardiomyocytes; dotted line demarcates the heart cone. (C-D′′) Reduced GFP signaling was observed in the linear heart tube (LHT) of ethanol exposed embryos at 24 (C′, C′′) and 30 hpf (D′, D′′) compared to control (C, D). (E-I′′) Examination of Bmp activity from 38-74 hpf showed progressively restricted Bmp activity in the chamber cardiomyocytes and strong activity at the AVC in control embryos (E-I); ethanol treated embryos showed lack of restriction of Bmp activity at the AVC (E′-I′′) and occasional weak BMP activity in the heart (H′′). Dotted line demarcates the heart. A: Atrium, V: Ventricle. EXPRESSION / LABELING:
PHENOTYPE:
|
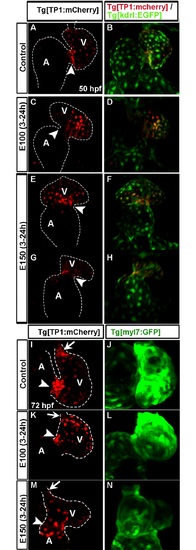
High Notch activity was not restricted at the AVC endocardial cells in ethanol exposed embryos. (A-H) Tg(TP1:mCherry);Tg(kdrl:EGFP) double transgenic embryos showed compact cluster of strong mCherry labeled cells at the AVC and weak mCherry labeled cells in the ventricular endocardial lining in control embryo at 50 hpf (A, B); ethanol treated embryos had a mix of strong and weak mCherry labeled cells in the endocardium and no cluster of strong mCherry labeled cell at the AVC (C-H); severely defective embryo exhibited weaker mCherry labeling relative to the control (G, H). (I-N) Tg(TP1:mCherry);Tg(myl7:GFP) double transgenic embryos showed compact clusters of strong mCherry labeled cells at the AVC and OFT at 72 hpf in control (I) and no clustering in ethanol treated embryos (K, M); green fluorescence in Tg(TP1:mCherry);Tg(myl7:GFP) embryos showed myocardium at 72 hpf (J, L, N). A: Atrium, V: Ventricle, Arrowheads: AVC, Arrows: OFT. EXPRESSION / LABELING:
PHENOTYPE:
|

High Notch-active cells present in the ventricular endocardium in ethanol exposed embryos showed F-actin expression. (A-B′′) Texas-red phalloidin stained 52 hpf Tg(TP1:mCherry) embryos showed strong mCherry labelled endocardial cells confined at the AVC in control embryo (A-A′′: at the surface of AVC; (B-B′′): cells inside AVC); Strong Notch positive cells along with a few neighboring cells expressed high level of F-actin and were cuboidal in shape (White dotted lines). (C) 3D rendering of optical Z-sections through heart showing distribution of strong and weak Notch active cells in the heart of control embryo. (D) 3D rendering of phalloidin stained embryos showing shape of the control embryo heart. (E-G′′, J-L′′) Ethanol treated and Texas-red phalloidin stained Tg(TP1:mCherry) embryos showed strong mCherry labelled endocardial cells at a lesser extent at the AVC endocardium (E-E′′, J-J′′), but more inside the ventricle (F-G′′, K-L′′). Notch active cells in the chamber endocardium showed ectopic F-actin labeling (F′-G′′, K′-L′′). White dotted lines show cuboidal cells. (H, M) 3D rendering of optical Z-sections through heart showing distribution of strong and weak Notch active cells in the heart of ethanol treated embryos. (I, N) 3D rendering phalloidin stained embryos showing the shape of the heart of ethanol treated embryos compared to control (D). ES-AVC: Endocardial cells at the surface of AVC, A: Atrium, V: Ventricle. |
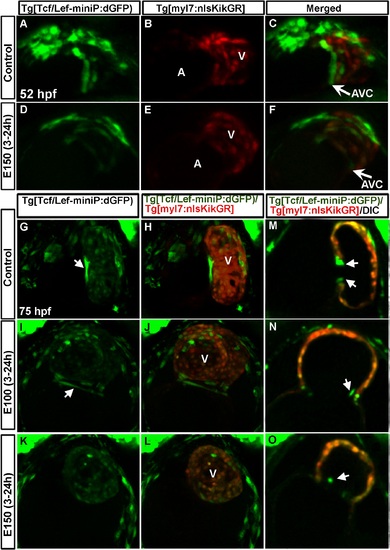
Wnt activity was reduced in heart during AVC differentiation due to embryonic ethanol exposure. (A-F) Tg(Tcf/Lef-miniP:dGFP);Tg(myl7:nlsKikGR) double transgenic zebrafish showed two rows of cardiomyocytes (red cells) at the AVC expressing GFP (Wnt active) in control embryos (A-C); ethanol treated embryos showed weak GFP expressing cardiomyocytes that were not restricted at the AVC (D-F) at 52 hpf. (G-L) Tg(Tcf/Lef-miniP:dGFP);Tg(myl7:nlsKikGR) double transgenic zebrafish showed long cardiomyocytes with strong GFP signal at the AVC and faint GFP signal in the ventricular cardiomyocytes in control embryos (G, H); ethanol exposed embryos showed weak GFP labeling at the AVC as compared to control (I-L). Arrows: Long cardiomyocytes with strong GFP signal. (M-O) Optical section of the heart of 75 hpf embryos showed GFP expression in the endocardial cells (arrowheads) at the AVC in the control embryo (M) and in ethanol treated embryos (N, O). A: Atrium, V: ventricle. EXPRESSION / LABELING:
PHENOTYPE:
|

Phospho-Smad-1/5/9 positive cardiomyocytes were seen throughout the ventricle in ethanol-exposed embryos. (A-I) 3D reconstruction of confocal sections of phospho-Smad-1/5/9 (A, D, G) and MF20 (B, E, H) double immunostained embryos showed Bmp responsive phospho-Smad-1/5/9 positive cardiomyocytes at the base of the atrium and in the inner curvature of the ventricle in control embryos (A); regionalization of phospho-Smad-1/5/9 positive cardiomyocytes were not evident in ethanol exposed embryos (D, G); A′, D′, G′: magnified images of boxed areas of A, D, G. |
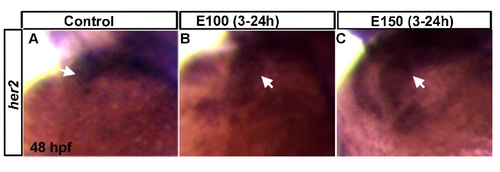
Expression of her2 in the heart. (A-C) her2 expression in the control heart (A); her2 expression in ethanol treated embryo hearts (B, C). Arrow: heart. |

Expression of axin2 in the heart. (A-C) In situ hybridization detecting axin 2 showed expression of the gene in the heart near AVC in control embryos (A); weak expression in E100 ethanol treated embryo (B) and no expression in E150 ethanol treated embryo. Arrows: pointing axin 2 expression in the heart. |