
- Title
-
Long-term drug administration in the adult zebrafish using oral gavage for cancer preclinical studies
- Authors
- Dang, M., Henderson, R.E., Garraway, L.A., Zon, L.I.
- Source
- Full text @ Dis. Model. Mech.
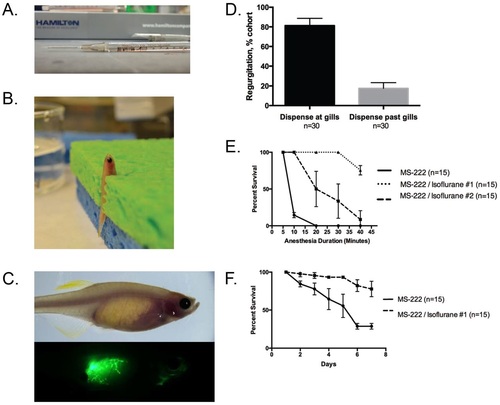
Technical optimization of oral gavage technique. (A) The gavage apparatus was constructed from a 10µl luer-tip Hamilton syringe with a 22G needle and 22G soft-tip catheter tubing. (B) A representative zebrafish was anesthetized using a MS-222/isoflurane combination anesthetic and immobilized vertically in a damp sponge with a slit. (C) A representative zebrafish was gavaged with 3µl fluorescein isothiocyanate-dextran (FITC-dextran) to visualize potential regurgitation via fluorescence microscopy. (D) Zebrafish were gavaged with Phenol Red solution to visualize potential regurgitation. Data represented as mean±s.d. of two replicates. (E) Survival curve for extended exposure to anesthetic solutions. Data represented as mean±s.d. of three replicates. (F) Survival curve for long-term daily exposure to anesthetic solution. Data represented as mean±s.d. of three replicates. |
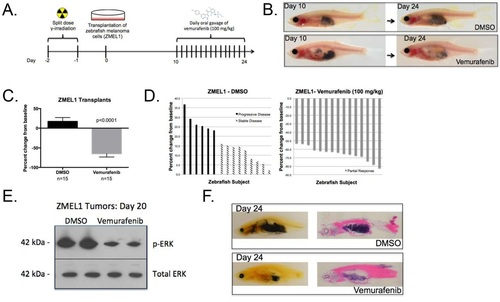
BRAFV600E inhibitor treatment of zebrafish melanoma cell line (ZMEL1) transplants. (A) Experimental workflow: MHC caspers were exposed to 30Gy split-dose of sub-lethal irradiation day -2 and -1 prior to transplantation on day 0. MHC caspers were transplanted with 500,000 zebrafish melanoma cells (ZMEL1) and allowed a 10-day period for melanoma engraftment and proliferation. A two-week regimen of daily oral gavage of DMSO-control or 100mg/kg Vemurafenib began on day 10. (B) The top panel shows a representative ZMEL1-transplanted zebrafish treated with DMSO control over a two-week treatment regimen. The bottom panel shows a representative ZMEL1-transplanted zebrafish treated with 100mg/kg Vemurafenib over a two-week treatment regimen. (C) Average percent change from baseline of tumor area based on pigmentation in a cohort with n=15 in each treatment arm. Two-tailed paired t-test was performed for statistical analysis. Data represented as mean±s.d. of three replicates. (D) Waterfall plot depicting the range of response for the experimental cohorts, DMSO and Vemurafenib. The response was quantified by percent change of tumor area from baseline. (E) ZMEL1 tumors from DMSO control (lanes 1 and 2) and Vemurafenib-treated (lanes 3 and 4) cohorts were isolated at day 20. MAPK activity was measured via phosphorylated-ERK with total ERK as a loading control. (F) Paraffin section (left) and H&E stain (right) of representative zebrafish within a DMSO (top panel) or Vemurafenib (bottom panel) cohort at day 24. |
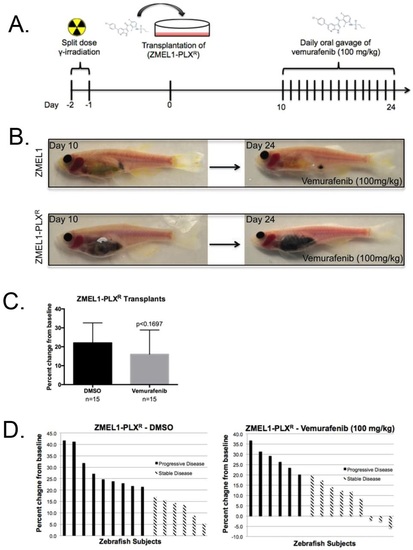
BRAFV600E inhibitor treatment of drug-resistant zebrafish melanoma cell line (ZMEL1-PLXR) transplants. (A) Experimental workflow: MHC caspers were exposed to 30 Gy split-dose of sub-lethal irradiation day -2 and -1 prior to transplantation on day 0. ZMEL1 cells were exposed to low-dose (50¼M) Vemurafenib in culture for 4months to select a drug-resistant population, named ZMEL-PLXR. MHC caspers were transplanted with 500,000 ZMEL-PLXR cells at day 0. Following a 10-day engraftment and proliferation period, the transplanted zebrafish began a two-week regimen of daily oral gavage of DMSO control or 100mg/kg Vemurafenib. (B) The top panels show a representative zebrafish transplanted with drug-naïve ZMEL1 cells in the intraperitoneal cavity at day 10 and the right panel shows the same zebrafish after 2 weeks of daily oral gavage of 100mg/kg Vemurafenib. The bottom panels show a representative zebrafish transplanted with drug-resistant ZMEL-PLXR cells in the intraperitoneal cavity at day 10 and the right panel shows the same zebrafish after 2 weeks of daily oral gavage of 100mg/kg Vemurafenib. (C) Average percent change from baseline of tumor area based on pigmentation in a cohort with n=15 in each treatment arm. Two-tailed paired t-test was performed for statistical analysis. Data represented as mean±s.d. of three replicates. (D) Waterfall plots depict the range of response for the experimental cohorts, DMSO and Vemurafenib. The response was quantified by percent change of tumor area from baseline. PHENOTYPE:
|

BRAFV600E inhibitor treatment of primary zebrafish melanoma transplants. (A) MHC caspers were transplanted with MiniCoopR:eGFP control melanoma tumors. The top panel shows the tumor burden of a representative zebrafish prior to DMSO treatment at day 10 and after a 2-week treatment with DMSO at day 24. The bottom panel shows the tumor burden of a representative zebrafish prior to Vemurafenib treatment at day 10 and after a 2-week treatment regimen with Vemurafenib at day 24. (B) Average percent change from baseline of tumor area based on pigmentation in a cohort with n=14 or n=15 in the DMSO or Vemurafenib-treated arm, respectively. Two-tailed paired t-test was performed for statistical analysis. Data represented as mean±s.d. of three replicates. (C) Waterfall plots depict the range of response for the experimental cohorts, DMSO and Vemurafenib. The response was quantified by percent change of tumor area from baseline. (D) MHC caspers were transplanted with MiniCoopR:MEK1DD melanoma tumors. The top panel shows the tumor burden of a representative zebrafish prior to DMSO treatment at day 10 and after a 2-week treatment with DMSO at day 24. The bottom panel shows the tumor burden of a representative zebrafish prior to Vemurafenib treatment at day 10 and after a 2-week treatment regimen with Vemurafenib at day 24. (E) Average percent change from baseline of tumor area based on pigmentation in a cohort with n=10 or n=12 in the DMSO or Vemurafenib-treated arm, respectively. Two-tailed paired t-test was performed for statistical analysis. Data represented as mean±s.d. of two replicates. (F) Waterfall plots depict the range of response for the experimental cohorts, DMSO and Vemurafenib. The response was quantified by percent change of tumor area from baseline. PHENOTYPE:
|

BRAFV600E inhibitor treatment of primary zebrafish melanoma tumors. (A) On the left, a representative MCR:eGFP zebrafish with primary tumors along its dorsal side was treated with DMSO control for 2weeks via oral gavage. On the right, a representative MCR:eGFP zebrafish with primary tumors along its dorsal side was treated with 100mg/kg Vemurafenib for 2weeks via oral gavage. The fixed dotted red line represents the tumor area pre-treatment. (B) Average percent change from baseline of tumor area based on pigmentation in a cohort with n=6 in the both the DMSO- or Vemurafenib-treated arm. Two-tailed paired t-test was performed for statistical analysis. Data represented as mean±s.d. of three replicates. (C) Waterfall plots depict the range of response for the experimental cohorts, DMSO and Vemurafenib. The response was quantified by percent change of tumor area from baseline. |

Limit dilution of transplanted ZMEL1. (A) Casper recipients were sublethally irradiated and intraperitoneally transplanted with a 10,000 zebrafish melanoma cell line, ZMEL1. (B) 100,000 ZMEL1 (C) 250,000 ZMEL1 (D) 500,000 ZMEL1. |