
- Title
-
The Polycomb Group Protein Pcgf1 Is Dispensable in Zebrafish but Involved in Early Growth and Aging
- Authors
- Dupret, B., Völkel, P., Le Bourhis, X., Angrand, P.O.
- Source
- Full text @ PLoS One

Expression of Psc orthologs during zebrafish development. Whole-mount in situ analyses of pcgf1, bmi1a, bmi1b, pcgf5a, pcgf5b and pcgf6 zebrafish genes at 0.75, 2.25, 4, 8, 12, 16 and 24 hpf were representatively shown. |
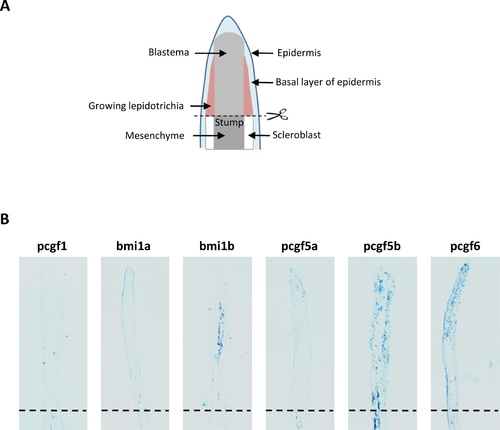
Expression of the Pcgf family member during caudal fin regeneration (A) Schematic representation of the regenerating caudal fin structures. (B) In situ hybridization with pcgf1, bmi1a, bmi1b, pcgf5a, pcgf5b and pcgf6 RNA anti-sense probes on sections of regenerating caudal fins from 6 month-old zebrafish at 4 days post-amputation (dpa). Dashed lines indicate the amputation plane. EXPRESSION / LABELING:
|

Generation of a pcgf1 mutant line using the TALEN technology. (A) Schematic representation of the genomic structure of the pcgf1 gene, with coding and untranslated exon depicted as solid and open boxes, respectively. The exonic regions coding for the conserved RING finger motif are shown in orange. The location of the pcgf1 TALEN in exon 2 is indicated. The pcgf1 TALEN target sequence with Left and Right TALEN binding sites in red is shown. The ClaI restriction site is indicated in green. (B) Identification of mutant embryos using a diagnostic restriction. Genomic DNA was prepared from an uninjected (Control) and a pcgf1 TALEN injected (TAL-pcgf1) embryo. The TALEN targeted DNA region is amplified by PCR and subjected to ClaI digestion. The TAL-pcgf1 injected embryo contains undigested material (arrow at 507 bp), indicating that the ClaI diagnostic restriction site has been disrupted. (C) Sequence of the mutant allele compared to its wild-type counterpart. Dashes indicate deleted nucleotides. For the peptide sequence, the gray line indicates residues read out of frame prior to encountering a premature stop codon and the red triangle corresponds to the RING finger motif in the wild-type protein. Size of the predicted proteins is indicated. (D) Pictures of siblings from a pcgf1+/- x pcgf1+/- cross at 7 months. The genotype of the fish was established using the ClaI diagnostic restriction on genomic DNA obtained by fin clipping. (E) Global monoubiquitinylation of histone H2A is not affected in pcgf1-/- mutants. Total histone from pools of 5 embryos at 7 dpf were extracted and analyzed by western blotting. The efficiency of the transfer on the membrane is verified by Ponceau staining (Left) before incubation with anti-H2AK119ub1 and anti-H4 antibodies (Right). EXPRESSION / LABELING:
|
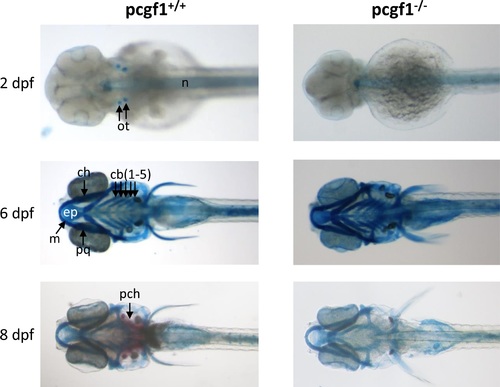
Development of cartilages and bones in pcgf1-/- mutants. Alcian blue stained head cartilages and Alizarin red stained head bones of pcgf1+/+ (Left) and pcgf1-/- mutant lines (Right) at the indicated developmental points. Note that ossification is visible at 8 dpf in the wild-type but not in the mutant. cb: ceratobranchials; ch: ceratohyal; ep: ethmoid plate; m: Meckel’s cartilage; n: notochord; ot: otoliths; pch: parachordal plate; pq: palatoquadrate. |
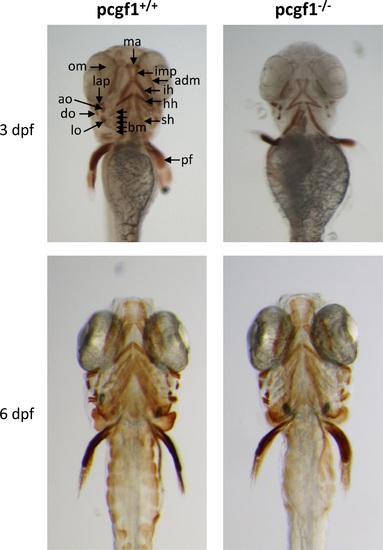
Cranial musculature in pcgf1-/- mutants. Cranial musculature revealed by immunocytochemistry using the anti-myosin MF20 antibody shows that muscle development is delayed at 3 dpf but normal at 6 dpf in pcgf1-/- larvae. adm: adductor mandibulae; ah: adductor hyomandibulae; ao: adductor operculi; bm: branchial musculatur; do: dilatator operculi; h: heart; hh:hyohyoideus; ih: interhyoideus; ima: intermandibularis anterior; imp: intermandibularis posterior; lap: levator arcus palatini; lo: levator operculi; om: occular muscle; pf: pectoral fin; sh: sternohyoideus. EXPRESSION / LABELING:
PHENOTYPE:
|

Growth of pcgf1-/- mutants at early developmental stages. (A) Comparison of pcgf1+/+ and pcgf1-/- embryo development during the cleavage period. Embryos from wild-type and mutant lines were fixed at 0.5, 1, 1.5 and 2 hpf, then 1-, 2-, 4-, 8-, 16-, 32-, 64-, 128- and 256-cell embryos were then counted, and results are expressed as the number of cells per embryo; n > 100 embryos per time point for each genotype. (B) Comparison of pcgf1+/+ and pcgf1-/- embryo development at blastula and gastrula periods. Embryos were fixed at 4.5 and 6 hpf and representative embryos are shown. At 6 hpf embryos can be classified into 2 classes and the proportion of embryos of each group is indicated; n > 100 embryos. (C) Comparison of the size from head to tail, of fixed pcgf1+/+ and pcgf1-/- larvae at 2, 3, 4, 5 and 6 dpf; Error bars indicate ± SD. Statistical significance was assessed by Student t-test analysis and significance expressed as the value of p (*, p < 0.1; **, p < 0.01, ***, p < 0.001). Measurements on embryos and larvae were done on 3 independent experiments using materials from different (3 to 6) layings. |
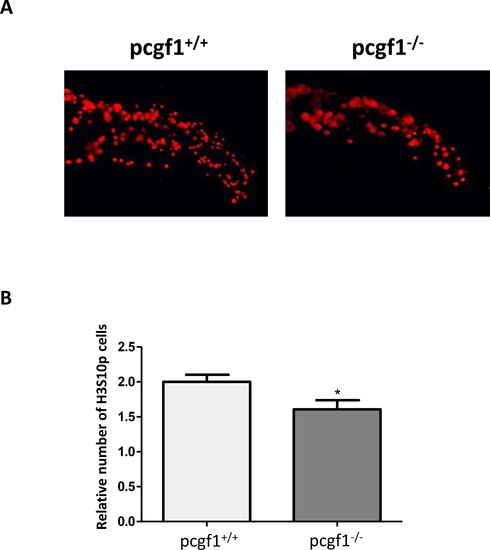
Cell proliferation measured by whole-mount immunohistochemistry using an anti-phosphohistone H3 antibody. (A) Antibody staining against phosphorylated histone H3 (anti-H3S10p) in pcgf1+/+ and pcgf1-/- 24 hpf embryos. The caudal fin fold region of representative embryos is shown. (B) Quantification of H3S10p spots in the caudal fin fold expressed per unit of surface since pcgf1+/+ and pcgf1-/- embryos have different sizes at this developmental stage. Error bars indicate ± SD. Statistical significance was assessed by Student t-test analysis and significance expressed as the value of p and * indicates p < 0.01. |

Phenotype of 12 month-old pcgf1-/- mutants. (A) Pictures of 12 month-old pcgf1+/+ and pcgf1-/- fish. Note that both male and female pcgf1-/- fish exhibit mild spinal curvature. (B) Measurements of the spinal curvature score in 12 month-old fish from the pcgf1+/+ and pcgf1-/- populations. Statistical significance was assessed by Student t-test analysis and significance expressed as the value of p. (C) Senescence-associated β-galactosidase (SA-β-Gal) activity in 12 month-old zebrafish. Whole body staining of SA-β-Gal activity in pcgf1+/+ and pcgf1-/- fish harboring a spinal curvature are compared. (D) Quantification of SA-β-Gal activity in pcgf1+/+ and pcgf1-/- fish. Blue pixels obtained by whole body staining of SA-β-Gal activity were quantified in the trunk area between the operculum and the dorsal and anal fins by Adobe Photoshop and plotted using Prism (GraphPad). Error bars indicate ± SD. PHENOTYPE:
|

Method of measurement of the spinal curvature score in zebrafish. A body midline is drawn and measured between the tip of the caudal peduncle and the center of the occipital orbit (b). A perpendicular line is then drawn from the midline to the apex of the fish body (a). The spinal curvature score is defined as the ratio of the length of the perpendicular line relative to the length of the fish (a/b). |

The bmi1a 3′UTR reduces GFP expression levels in zebrafish embryos. (A) Comparison of bmi1a and bmi1b expression levels during zebrafish development analyzed by whole-mount in situ hybridization. Note that bmi1a transcripts are not detected at 8 hpf while bmi1b transcripts are present. (B) Organization of the bmi1a and bmi1b transcripts. A predicted base pairing between miR-430c and the bmi1a 3′UTR is shown. (C) Experimental set-up to test the effect of the bmi1a 3′UTR on GFP expression levels. A GFP reporter mRNA containing no 3′UTR (control), the bmi1a 3′UTR or the bmi1b 3′UTR is co-injected with control dsRed (RFP) mRNA into 1-cell stage embryos. (D) GFP reporter expression (green) and control dsRed expression (red) at 4-5 hpf monitor mRNA injection (left panels). GFP reporter expression and control dsRed expression at 28 hpf reveals that bmi1a 3′UTR reduces GFP expression levels (right panels). (E) Quantification of relative GFP expression levels. Error bars indicate ± SD; n > 15 embryos per experiment; Statistical significance was assessed by Student t-test analysis and significance expressed as the indicated p values. |
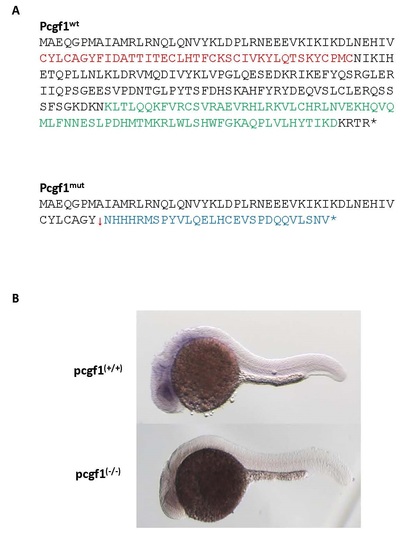
Products of the pcgf1Δ11 allele. (A) Predicted protein encoded by the pcgf1Δ11 allele (Pcgf1mut) compared to the wild-type Pcgf1 protein. Peptides coding for the RING finger and the PCGF conserved motif are indicated in red and green, respectively [40]. (B) Whole-mount in situ analysis of pcgf1 expression on pcgf1+/+ and pcgf1-/- embryos at the prim-5 stage (about 24 hpf). |
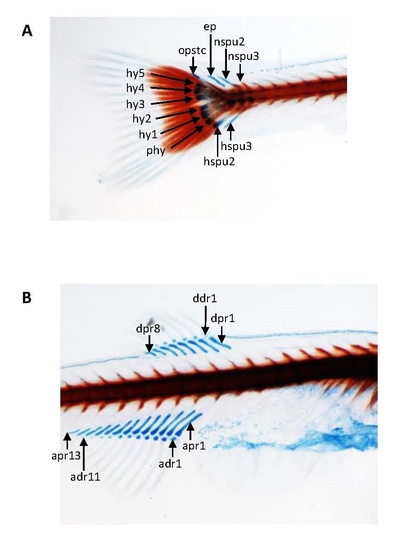
Skeletal development of pcgf1-/- zebrafish mutants using Alcian blue-Alizarin red double staining. Details of the cartilage and bone structures at the caudal (A), dorsal and anal fins (B) show that skeletal structures are formed, calcified and normal at 21 dpf. ep, epural; hspu: haemal spine of preural; hy: hypural; nspu: neural spine of preural; opstc: opistural cartilage; phy: parhypural; adr: anal distal radial; apr: anal proximal radial; ddr: dorsal distal radials; dpr: dorsal proximal radial. |

Analysis of apoptosis and senescence in pcgf1-/- mutants at 24 hpf. (A) Apoptosis detection by Acridine orange staining of live embryos at 24 hpf. The caudal fin fold region of representative embryos is shown. (B) Senescence-associated β-galactosidase detection in 24 hpf embryos. Representative pcgf1+/+ and pcgf1-/- embryos are shown. |

Phenotype of 6 month-old pcgf1-/- zebrafish. Example of 6 month-old pcgf1-/- zebrafish harboring no (top), weak (middle) or more pronounced (bottom) spinal curvatures. |