
- Title
-
Developmental Apoptosis Mediates Entry and Positioning of Microglia in the Zebrafish Brain
- Authors
- Casano, A.M., Albert, M., Peri, F.
- Source
- Full text @ Cell Rep.

Dynamics of Microglial Brain Colonization and Neuronal Apoptosis (A-C) Macrophage cell segmentation (A [t = 0 hr] and B [t = 10.75 hr]) and cell tracking (C) of a representative wild-type mpeg1::GAL4-UAS::Kaede embryo, imaged for 10.75 hr ( Movie S1). In orange are the proliferating and in green are the invading macrophages/tracks. Yellow marks cells resulting from division. Examples of single tracks are given in (i), (ii), and (iii). (D and E) Dorsal view of a mpeg1::GAL4-UAS::Kaede embryo after microglia photo-conversion (D) and 24 hr later (E). Microglia that entered the brain after photo-conversion are green. Microglia derived from proliferating converted cells are in red/yellow. Dotted lines mark the tectal area. (F) Quantifications of microglial photo-conversion at different developmental time points. In each graph, the histogram on the left represents the number of microglia photo-converted at a given time point (in red). The histogram on the right indicates the number of microglia entering the brain after conversion (green bar) or deriving from proliferation (yellow bar) 24 hr after photo-conversion. (G) Experimental setup. Microglia are photo-converted at different time points. Then, 24 hr after each round of photo-conversion, green and red/yellow cells are quantified. (H) Schematic illustrations of a 3-dpf embryo (side and dorsal views). The red line marks the depth at which confocal imaging was performed. (I and J) Quantifications of the number of microglia (I) and apoptotic nuclei (J) in wild-type and pU.1-morphant brains, respectively, are shown. OT, optic tectum; HB, hindbrain; AO, acridine orange; n, number of embryos. For all quantifications, data are pooled from three independent experiments. Scale bar represents 30 µm. See also Figure S1 and Movie S1. EXPRESSION / LABELING:
|
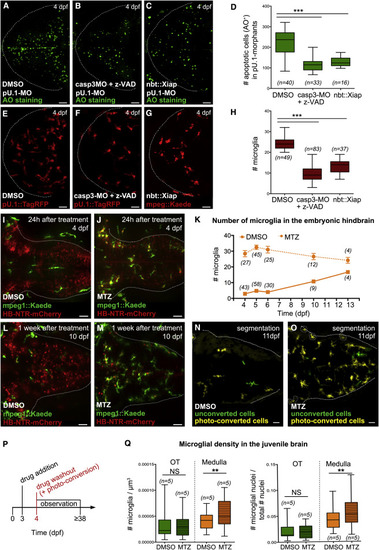
Neuronal Cell Death Affects Size and Distribution of the Microglial Population (A-D) AO staining (A-C) and quantifications (D) of apoptotic nuclei in 4-dpf pU.1-morphant embryos treated with DMSO (A), caspase-3-morpholino + z-VAD-fmk (B), and neuronal xiap overexpression (C) are shown. (E-H) Distribution (E-G) and quantification (H) of microglia in the optic tectum of 4-dpf pU.1::GAL4-UAS::TagRFP and mpeg1::GAL4-UAS::Kaede embryos treated with DMSO (E), caspase-3-morpholino + z-VAD-fmk (F), and neuronal xiap overexpression (G) are shown. (I, J, L, and M) Hindbrain dorsal views of an mpeg1::GAL4-UAS::Kaede;HB-NTR-mCherry embryo 24 hr (I and J) and 1 week (L and M) after treatment with DMSO or MTZ are shown. (K) Quantification of hindbrain microglia in mpeg1::GAL4-UAS::Kaede;HB-NTR-mCherry embryos, at different time points after pulsed treatment with DMSO or MTZ. Numbers indicate how many embryos have been analyzed. (N and O) Manual segmentation of photo-converted microglia (yellow cells) and new invading macrophages (green cells) in the hindbrain of a representative mpeg1::GAL4-UAS::Kaede;HB-NTR-mCherry larva 1 week after pulse of DMSO or MTZ and hindbrain microglia photo-conversion (original data in Figures S3I and S3J). NTR-mCherry+ neurons are omitted. Macrophages located superficially in the skin, outside the brain, are encircled with a white dotted line. (P) Experimental setup. At 3 dpf, NTR-mCherry+ embryos are treated with DMSO or MTZ. Then 24 hr later the drug is removed and hindbrain microglia are photo-converted. Microglia in the hindbrain are quantified at different developmental time points. (Q) Accumulation of microglia in the optic tectum and medulla oblongata of mpeg1::GAL4-UAS::Kaede;HB-NTR-mCherry juvenile fish, ~1 month after DMSO or MTZ treatment. Microglial densities are calculated as the number of microglia/micron3 or as the ratio between the number of microglia and the total number of nuclei. AO, acridine orange; OT, optic tectum; n, number of embryos or fish; NS, non-significant; **p < 0.01 and ***p < 0.001. Dotted lines delimit the regions of interest. For all quantifications, data are pooled from three independent experiments. Scale bar represents 30 µm. See also Figures S1, S2, and S3. EXPRESSION / LABELING:
PHENOTYPE:
|
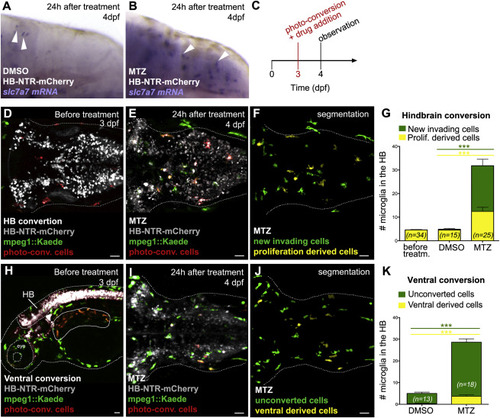
Neuronal Apoptosis Promotes Microglial Brain Colonization by Attracting Macrophages into the Brain (A and B) Whole mount in situ hybridization (WISH) images show slc7a7 expression (white arrowheads) in HB-NTR-mCherry transgenic embryos 24 hr after DMSO (A) or MTZ (B) treatment. (C) Experimental setup. At 3 dpf, Kaede+ cells are photo-converted in the hindbrain or ventral region of NTR-mCherry+ embryos and soon after samples are treated with DMSO or MTZ. Then 24 hr later green and red/yellow cells are quantified in the hindbrain. (D and E) Hindbrain dorsal views of a 3-dpf mpeg1::GAL4-UAS::Kaede;HB-NTR-mCherry embryo, after microglia photo-conversion and prior to drug treatment (D) and 24 hr after photo-conversion and MTZ treatment (E). New invading microglia are in green and microglia derived from converted cells are in red/yellow. (F and J) Segmented images of (E) and (I), respectively. NTR-mCherry+ neurons are omitted. (G) Quantification of hindbrain microglia after induction of apoptosis. Histogram on the left refers to the number of photo-converted microglia populating the hindbrain prior to MTZ incubation; histograms on the right represent the number of newly arrived microglia (green bars) and those resulting from local proliferation (yellow bars) 24 hr after photo-conversion and DMSO or MTZ treatment. Data are from three independent experiments. (H) Lateral view shows a 3-dpf mpeg1::GAL4-UAS::Kaede;HB-NTR-mCherry embryo, after photo-conversion of Kaede+ macrophages in the ventral region (red cells, solid line) and before MTZ treatment. (I) Hindbrain dorsal view of an mpeg1::GAL4-UAS::Kaede;HB-NTR-mCherry embryo, 24 hr after ventral photo-conversion and MTZ treatment. Invading cells deriving from the ventral region are in red/yellow. (K) Number of hindbrain microglia in mpeg1::GAL4-UAS::Kaede;HB-NTR-mCherry embryos, 24 hr after ventral photo-conversion and drug treatment. Data are from three independent experiments. HB, hindbrain; n, number of embryos; NS, non-significant; ***p < 0.001. NTR-mCherry+ neurons are in gray. Dotted line marks the hindbrain area or the embryo outline. Scale bar represents 30 µm. EXPRESSION / LABELING:
PHENOTYPE:
|
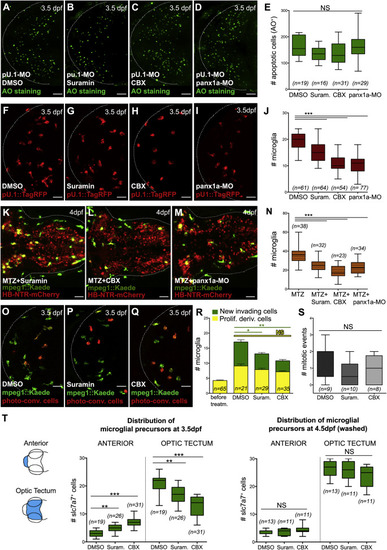
Nucleotide Release Downstream of Neuronal Cell Death Recruits Microglial Precursors into the Brain (A-E) AO staining (A-D) and quantification (E) of apoptotic nuclei in 4-dpf pU.1-morphant embryos, 24 hr after treatment with DMSO (A), suramin (B), CBX (C), and pannexin1a-MO (D), are shown. (F-J) Microglial distribution (F-I) and quantification (J) in pU.1::GAL4-UAS::TagRFP embryos, 24 hr after treatment with DMSO (F), suramin (G), CBX (H), and pannexin1a-MO (I), are shown. (K-N) Representative hindbrain (K-M) and quantification (N) of an mpeg1::GAL4-UAS::Kaede;HB::NTR-mCherry embryo at 4 dpf, 24 hr after treatment with MTZ + suramin (K), MTZ + CBX (L), and MTZ + pannexin1a-MO (M). Dotted lines mark the hindbrain. (O-Q) Dorsal views of mpeg1::GAL4-UAS::Kaede embryos 24 hr after photo-conversion of microglia and treatment with DMSO (O), suramin (P), and CBX (Q). Newly entered microglia are in green. Microglia derived from converted cells are in red/yellow. (R) Quantification of microglia deriving from cell invasion and in loco proliferation 24 hr after photo-conversion and drug treatment is shown. (S) Quantification of mitotic events in the optic tectum of 2.5-dpf mpeg1::GAL4-UAS::Kaede embryos during <15 hr of DMSO, suramin, or CBX treatment is shown. (T) Number of slc7a7+ microglial precursors accumulating in the anterior head region and in the optic tectum of slc7a7::Kaede embryos, 24 hr after drug treatment (graph on the left) and drug washout (graph on the right). Blue-colored areas in the schematic indicate the regions of interest. For all quantifications, data are pooled from three independent experiments. Dotted line delimits the areas of interest. n, number of analyzed embryos; NS, non-significant; *p < 0.05, **p < 0.01, and ***p < 0.001. Scale bar represents 30 µm. See also Figures S3 and S4. EXPRESSION / LABELING:
PHENOTYPE:
|

Reducing brain apoptosis does not affect the total number of leukocytes in the developing embryo. Related to Figure 1 and Figure 2. (A-I) Distribution of microglia and apoptotic nuclei during brain development. Microglia were imaged in pU.1::Gal4-UAS::TagRFP embryos (A, D, G) or by WISH with a probe against apoE (B, E, H). (C, F, I) Acridine orange staining in pU.1-morphant embryos. Dotted lines mark the brain region. Cells outside of this area are located on the skin and excluded from quantifications. Figure S1 B is a composite of two pictures focusing on different planes of the same sample. (J and K) Lateral view of a representative pU.1::GAL4-UAS::TagRFP embryo at 4dpf, treated with DMSO (J) and z-VAD-fmk + caspase-3 morpholino (K). Dotted lines mark the embryo. (L) Quantification of leukocytes in 4dpf pU.1::GAL4-UAS::TagRFP embryos treated with DMSO and z-VAD-fmk + caspase-3 morpholino. Cells are quantified in the trunk and the tail, as indicated in the schematic (blue-colored areas). (M and N) WISH using a probe agaist xiap in 4 days old pU.1-morphant embryos in the absence (M) or presence (N) of nbt::Xiap expression. White arrowheads indicate xiap+ neurons. Scale bar, 30µm. n, number of analyzed embryos. NS, non significant. |

The number of microglia increases in response to UV-induced neuronal apoptosis. Related to Figure 2. (A-B), (D-E) Representative time-lapse images showing microglia (red) and apoptotic cells stained with acridine orange (green) in the optic tectum of a wild type pU.1::GAL4-UAS::TagRFP embryo (A, B) and in a pU.1::GAL4-UAS::TagRFP embryo injected with p53-morpholino (D, E), 3.5h and 7.5h after UV irradiation. (C and F) Schematic representation of (B) and (E), respectively. Orange dots mark the position of apoptotic nuclei 7.5h after UV irradiation. G, Quantification of apoptotic nuclei over time in control (solid line) or irradiated (dashed line) hemispheres in wild type (grey) and p53-morphants (purple). Asterisks refer to the statistical significance between control and irradiated hemispheres. Data from 3 independent experiments. (H) Quantification of microglia in control (empty box) and irradiated (lined box) hemispheres in wild type (grey) and p53-morphant (purple) brains, before irradiation, 5h and 24h post-irradiation. Data from 3 independent experiments. Dotted lines delimit the tectal area and the separation between the two hemispheres. White asterisks indicate the irradiated hemisphere. AO, acridine orange. hpi, hours post irradiation. Scale bar, 30µm. n, number of analyzed embryos. NS, non significant. * p < 0.05, *** p < 0.001. |
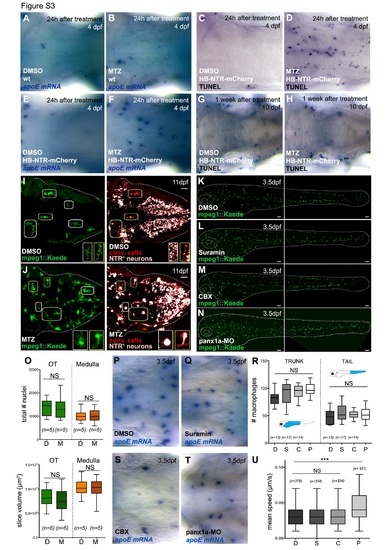
Ectopic neuronal cell death and nucleotide signaling affect microglial cell number. Related to Figure 2 and Figure 4. (A and B), (E and F) WISH using the microglial marker apoE in a 4 days old wild type (A-B) and HB-NTR- mCherry (E-F) embryo, 24h after DMSO or MTZ treatment. (C and D), (G and H) TUNEL staining showing apoptotic cells in the hindbrain of a representative HB-NTR-mCherry embryo 24h (C-D) and 1 week (G-H) after a pulse treatment of DMSO or MTZ. (I and J) Dorsal view of a representative mpeg1::GAL4-UAS::Kaede; HB-NTR-mCherry larva one week after DMSO (I) or MTZ (J) treatment and microglia photo-conversion in the hindbrain. Panels on the left show all microglial cells (Kaede green); panels on the right show photo-converted microglia (Kaede red) and NTR-mCherry+ neurons (in pink). Yellow and white boxes indicate examples of photo-converted cells and newly entered macrophages, respectively (higher magnifications in the insets). (K-N) Lateral view of a representative mpeg1::GAL4-UAS::Kaede embryo at 3.5dpf, 24h after treatment with DMSO, suramin, CBX or pannexin1a-MO. Dotted lines mark the embryo outline. (O) Quantification of nuclei (graph on the top) and slice volume (graph on the bottom) in the optic tectum and medulla oblongata of HB-NTR-mCherry juvenile fish, ~1 month after DMSO or MTZ treatment. Data from 3 independent experiments. n, number of analyzed fish. (P and Q), (S and T) WISH for apoE in a representative wild type embryo treated with DMSO, suramin, CBX or pannexin1a-MO. (R) Macrophage quantification in 3.5dpf mpeg1::GAL4-UAS::Kaede embryos treated as indicated in (K-N). Cells are quantified in the trunk and the tail as indicated in blue in the schematic. Data from 2 independent experiments. n, number of analyzed embryos. (U) Quantification of the basal motility of trunk macrophages in mpeg1::GAL4-UAS::Kaede embryos at 3.5dpf, 24 hours after drug treatment. Data from 2 independent experiments. n, number of analyzed cells. Dotted lines represent the embryo outline. D, DMSO. M, MTZ. S, suramin. C, CBX. P, pannexin1a- MO. Scale bar, 30µm. NS, non significant. *** p < 0.001. |
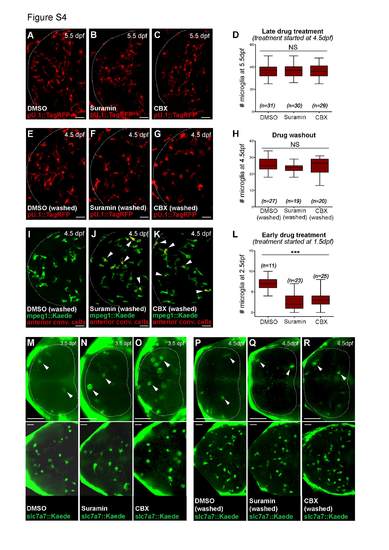
Inhibition of nucleotide signaling impairs microglial precursors invasion in response to cell death. Related to Figure 4. (A-D) Distribution (A-C) and quantification (D) of microglia in pU.1::GAL4-UAS::TagRFP embryos at 5.5dpf, 24h after DMSO, suramin and CBX treatment. Data from 2 independent experiments. (E-H) Microglial distribution (E-G) and quantification (H) in the optic tectum of pU.1::GAL4- UAS::TagRFP embryos at 4.5dpf, 24 hours after drug washout. Data from 3 independent experiments. (I-K) Dorsal view of mpeg1::GAL4-UAS::Kaede embryo showing invasion of macrophages after restoring nucleotide signaling. 24-hours after photoconversion and drug washout, macrophages that were present anteriorly are found inside the brain (red/yellow cells, white arrowheads). (L) Microglial distribution in the optic tectum of pU.1::GAL4-UAS::TagRFP embryos at 2.5dpf, 24h after DMSO, suramin and CBX treatment. Data from 2 independent experiments. (M-R) Distribution of microglial precursors in the anterior head region (upper panels) and optic tectum (lower panels) of the same slc7a7::Kaede embryos, 24h after drug treatment (M-O) or drug washout (P-R). White arrowheads indicate slc7a7+ cells. Dotted lines delimit the anterior region of the head. Scale bar, 30µm. n, number of analyzed embryos. NS, non significant. *** p < 0.001. |