
- Title
-
Microglia Colonization of Developing Zebrafish Midbrain Is Promoted by Apoptotic Neuron and Lysophosphatidylcholine
- Authors
- Xu, J., Wang, T., Wu, Y., Jin, W., Wen, Z.
- Source
- Full text @ Dev. Cell

Microglial Precursors Enter the Optic Tectum via Two Major Routes (A) Coronal (top) and transverse (bottom) views of time-lapse imaging pictures of the midbrain of Tg(-2.8elavl3:eGFP;coro1a:DsRedx) zebrafish embryos indicate one microglia (marked by white arrow) entering the optic tectum from the lateral periphery of the brain. The optic tectum and eyes are indicated by white dashed lines. Red and green signals represent coro1a-DsRedx+ microglia and elavl3-GFP+ neurons, respectively. E, eye; OT, optic tectum. (B) Coronal (top) and transverse (bottom) views of time-lapse imaging pictures of the midbrain of Tg(-2.8elavl3:eGFP;coro1a:DsRedx) zebrafish embryos show one microglia (marked by the white arrow) entering the optic tectum by passing through the ventral part of the midbrain. The optic tectum and eyes are indicated by white dashed lines. Red and green signals represent coro1a-DsRedx+ microglia and elavl3-GFP+ neurons, respectively. E, eye; OT, optic tectum. (C) A schematic diagram of the transverse plane to illustrate the entry routes for the colonization of the optic tectum by microglial precursors. Route 1, the lateral periphery of the brain; route 2, passing through the ventral part of the midbrain; route 3, the dorsal periphery of the brain. See also Figure S1 and Movie S1. EXPRESSION / LABELING:
|

Microglia Colonization of the Optic Tectum Is Circulation Independent (A) Coronal (top) and transverse (bottom) views of time-lapse imaging pictures of the midbrain of Tg(kdrl:eGFP;coro1a:DsRedx) zebrafish embryos reveal that microglia/microglial precursors (one microglia is marked by a magenta arrowhead) are outside vessels during their colonization of the optic tectum. Red signals represent coro1a-DsRedx+ microglia/microglial precursors. Green signals represent kdrl-GFP+ vessels within the ventral midbrain, whereas cyan signals indicate vessels above the ventral midbrain. The coronal views are stacked confocal images, whereas the transverse planes are single confocal images. (B) Dorsal view of the optic tectum of Tg(-2.8elavl3:eGFP;coro1a:DsRedx) zebrafish embryos injected with or without the tnnt2a MO. The number of optic-tectum-resident microglia only slightly decreased in the 3 dpf tnnt2a morphants but is drastically reduced in the 6 dpf tnnt2a morphants. Red and green signals represent coro1a-DsRedx+ microglia and elavl3-GFP+ neurons, respectively. The optic tectum is indicated by dashed lines. (C) Quantification of the number of optic-tectum-resident microglia in WT Tg(-2.8elavl3:eGFP;coro1a:DsRedx) embryos and tnnt2a morphants. Error bars represent the mean ± SEM. **p < 0.01, ***p < 0.001 (n = 6 for both WT and morphants at 3 dpf and 6 dpf). (D) Measurement of the width of the optic tectum of WT Tg(-2.8elavl3:eGFP;coro1a:DsRedx) embryos and tnnt2a morphants. Error bars represent the mean ± SEM. ***p < 0.001 (n = 5 for 3 dpf WT, n = 6 for 6 dpf WT, n = 6 for morphants at both 3 dpf and 6 dpf). (E) Coronal (top) and transverse (bottom) views of time-lapse imaging pictures of the midbrain of Tg(-2.8elavl3:eGFP;coro1a:DsRedx) zebrafish embryos show one microglia (labeled by white arrows) migrating out of the optic tectum in the 5.5 dpf tnnt2a morphants. The optic tectum is indicated by dashed lines. Red and green signals represent coro1a-DsRedx+ microglia and elavl3-GFP+ neurons, respectively. OT, optic tectum. See also Figure S2 and Movie S2. EXPRESSION / LABELING:
PHENOTYPE:
|
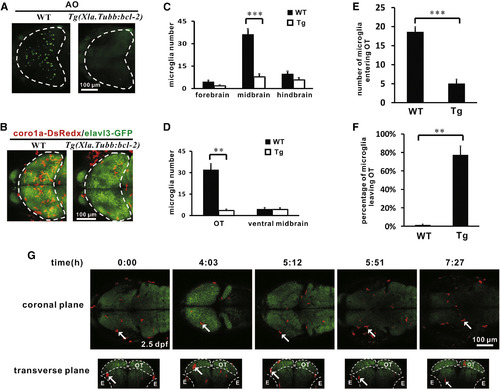
Neuron-Specific bcl-2 Overexpression Suppresses Neuronal Cell Death and Blocks Microglia Colonization of the Optic Tectum (A) Acridine orange (AO) staining reveals that neuronal cell death is largely prevented in the optic tectum of 3 dpf Tg(Xla.Tubb:bcl-2) embryos. The optic tectum is indicated by dashed lines. (B) The number of microglia in the optic tectum is drastically reduced in the optic tectum of 3 dpf Tg(Xla.Tubb:bcl-2) embryos. The optic tectum is indicated by dashed lines. Red and green signals represent coro1a-DsRedx+ microglia and elavl3-GFP+ neurons, respectively. (C) Quantification of the number of microglia in the forebrain, midbrain, and hindbrain of 3 dpf WT and Tg(Xla.Tubb:bcl-2) embryos. Error bars represent the mean ± SEM. ***p < 0.001 (n = 4). (D) Quantification of the number of microglia in the optic tectum and ventral midbrain of 3 dpf WT and Tg(Xla.Tubb:bcl-2) embryos. Error bars represent the mean ± SEM. **p < 0.01 (n = 4). (E) Quantification of the number of microglia that migrate into the optic tectum within the 24 hr imaging period (from 2 dpf to 3 dpf) of WT and Tg(Xla.Tubb:bcl-2) embryos. Error bars represent the mean ± SEM. ***p < 0.001 (n = 5 for WT embryos, n = 4 for transgenic embryos). (F) Quantification of the percentage of microglia that shuffle out of the optic tectum within the 24 hr imaging period (from 2 dpf to 3 dpf) of WT and Tg(Xla.Tubb:bcl-2) embryos. Error bars represent the mean ± SEM. **p < 0.01 (n = 5 for WT embryos, n = 4 for transgenic embryos). (G) Coronal (top) and transverse (bottom) views of time-lapse imaging pictures of the midbrain show a typical microglia (labeled by the white arrow) that enters the optic tectum and subsequently migrates out of the optic tectum in the Tg(Xla.Tubb:bcl-2) embryos. The optic tectum and eyes are indicated by dashed lines. Red and green signals represent coro1a-DsRedx+ microglia and elavl3-GFP+ neurons, respectively. E, eye; OT, optic tectum. See also Figure S3 and Movie S3. EXPRESSION / LABELING:
PHENOTYPE:
|

LPC Promotes the Entry of Microglial Precursors into the Brain (A) A schematic diagram of the dorsal view of zebrafish head. The red square indicates the region where LPC or ATPγS is injected. Normally the upper half-brain and lower half-brain are injected with LPC or ATPγS and control buffer, respectively. (B) Dorsal view of the ATPγS-injected brain of Tg(Xla.Tubb:bcl-2;mpeg1:loxP-DsRedx-loxP-GFP) embryos at 4-5 hpi. The upper half-brain is injected with ATPγS and the lower half-brain is injected with control buffer. DsRedx+ cells represent microglia. The midbrain is labeled by dashed lines. (C) Quantification of microglia in ATPγS-injected brain of Tg(Xla.Tubb:bcl-2;mpeg1:loxP-DsRedx-loxP-GFP) embryos at 4-5 hpi. n = 8 for control and ATPγS injection. DsRedx+ cells represent microglia. Error bars represent the mean ± SEM. (D) Dorsal view of the LPC-injected brain of Tg(Xla.Tubb:bcl-2;mpeg1:loxP-DsRedx-loxP-GFP) embryos at 4-5 hpi. The upper half-brain is injected with LPC and the lower half-brain is injected with control buffer. DsRedx+ cells represent microglia. White arrows indicate LPC-induced microglia in the brain. The midbrain is labeled by dashed lines. (E) Quantification of microglia in the LPC-injected brain of Tg(Xla.Tubb:bcl-2;mpeg1:loxP-DsRedx-loxP-GFP) embryos at 4-5 hpi. n = 17 for control and LPC injection. Error bars represent the mean ± SEM. ***p < 0.001. (F) Quantification shows that the number of microglia in the LPC-injected brain of Tg(Xla.Tubb:bcl-2;mpeg1:loxP-DsRedx-loxP-GFP) embryos is drastically decreased by 21 hpi. DsRedx+ cells represent microglia. n = 5. Error bars represent the mean ± SEM. **p < 0.01. (G) Time-lapse imaging pictures show that the microglia in the LPC-injected brain of Tg(mpeg1:loxP-DsRedx-loxP-eGFP) embryos gradually migrate out of the brain. DsRedx+ cells represent microglia. White arrowheads indicate one microglia migrating out of the brain. Dashed lines indicate the midbrain. (H) Dorsal view images of the midbrain of Tg(mpeg1:loxP-DsRedx-loxP-eGFP) control and gpr132b morphants (MO). DsRedx+ cells represent microglia. Dashed lines indicate the midbrain. (I) Quantification of the number of microglia number in the midbrain of Tg(mpeg1:loxP-DsRedx-loxP-eGFP) control and gpr132b morphants (MO). n = 14 for WT control and n = 15 for MO. Error bars represent the mean ± SEM. ***p < 0.001. See also Figure S4 and Movie S4. EXPRESSION / LABELING:
PHENOTYPE:
|

Microglia Distribution in Larval Zebrafish Brain, related to Figure 1 (A) Temporal-spatial distribution of microglia in the brains of 2 dpf and 3 dpf Tg(- 2.8elavl3:eGFP;coro1a:DsRedx) zebrafish embryos. The left panel is the schematic drawing of the dorsal view of zebrafish head region. The optic tectum (OT) is marked in light green. The red square indicates the imaged area of right panels. The right panels show the distribution of coro1a-DsRedx+ microglia (red) inside the elavl3-GFP+ brain (green). (B) Distribution of microglia in the forebrain, midbrain and hindbrain of 3 dpf Tg(- 2.8elavl3:eGFP;coro1a:DsRedx) zebrafish embryos. Red and green signals represent coro1a-DsRedx+ microglia and elavl3-GFP+ neurons respectively. (C) Quantification of microglia number in the forebrain, midbrain and hindbrain of 2 dpf, 3 dpf, and 5 dpf Tg(-2.8elavl3:eGFP;coro1a:DsRedx) embryos. Error bars represent mean SEM. ***: p<0.001. (n=6 for 2 dpf, n=12 for 3 dpf, n=6 for 5 dpf) (D) Distribution of microglia in the optic tectum and ventral midbrain (VM) of 3 dpf Tg(- 2.8elavl3:eGFP;coro1a:DsRedx) zebrafish embryos. The left panel is the schematic drawing of the lateral view of zebrafish brain, which includes the forebrain (FB), midbrain (MB) and hindbrain (HB). The black lines indicate the positions of the coronal optic sections for the optic tectum (upper right panel) and ventral midbrain (VM) (lower right panel). Red and green signals in right panels represent coro1a-DsRedx+ microglia and elavl3-GFP+ neurons respectively. (E) Quantification of microglia number in the optic tectum of the midbrain and the ventral midbrain in Tg(-2.8elavl3:eGFP;coro1a:DsRedx) embryos. Error bars represent mean SEM. ***: p<0.001. (n=6 for 2 dpf, n=12 for 3 dpf, n=6 for 5 dpf). |

Microglial Precursors Enter the Optic Tectum via Non-circulation route, related to Figure 2 (A) Dorsal view of the optic tectum of Tg(mpeg1:loxP-DsRedx-loxP-GFP) zebrafish embryos injected with or without the tnnt2a morpholno. The number of the optic tectum-resident microglia only slightly decreased in the 3 dpf tnnt2a morphants (MO) but is drastically reduced in the 6 dpf tnnt2a morphants. The optic tectum is indicated by dashed lines. (B) Quantification of the optic tectum-resident microglia number in WT embryos and tnnt2a morphants. Error bars represent mean SEM. **: p<0.01. ***: p<0.001. (n=8 for both WT and morphants at 3 dpf and 6 dpf) |

Colonization of the Optic Tectum by Microglial Precursor Depends on Apoptotic Neurons, related to Figure 3 (A) Acriding Orange (AO) staining (green) reveals the accumulation of apoptotic neurons in the optic tectum of the zebrafish brain from 2 dpf to 3 dpf and the subsequent reduction of apoptotic neurons at 6 dpf. The optic tectum is indicated by dashed lines. (B) WISH shows a robust expression of bcl-2 in the brain of the 3 dpf Tg(Xla.Tubb:bcl-2) embryos. (C) mfap4 WISH staining shows normal development of peripheral macrophages in Tg(Xla.Tubb:bcl-2) embryo during early development. (D) Photo-converted coro1a-Kaede+ microglia (red signals) in the optic tectum (white dashed lines) at 3 dpf and 6 dpf . (E) Quantification of Photo-converted coro1a-Kaede+ microglia at 3 dpf and 6 dpf . n=4 for 3 dpf and 6 dpf embryos. Error bars represent mean SEM. |

LPC-G2A Pathway Is Required for Microglial Precursors Entering the Brain, related to Figure 4 (A) AO staining showed that no excess apoptotic cells were observed in the brain injected with ATPγS or LPC, although the apoptotic cells could be readily observed in the brain of 3 dpf WT. (B) Dorsal view images of the midbrain of Tg(mpeg1:loxP-DsRedx-loxP-eGFP) control and gpr132a morphants (MO). DsRedx+ cells represent microglia. Dashed lines indicate the midbrain. (C) Quantification of the microglia number in the midbrain of Tg(mpeg1:loxP-DsRedx-loxPeGFP) control and gpr132a morphants (MO). n=8 for WT control and n=10 for MO. Error bars represent mean SEM. (D) Examination of gpr132a and gpr132b expression in macrophage and whole fish body by RTPCR at 2.5-3 dpf. (E) gpr132a MO efficiently blocked the expression of pCS2-gpr132a-ATG-DsRedx reporter construct. (F) gpr132b MO efficiently blocked the expression of pCS2-gpr132b-ATG-DsRedx reporter construct. EXPRESSION / LABELING:
PHENOTYPE:
|
Reprinted from Developmental Cell, 38(2), Xu, J., Wang, T., Wu, Y., Jin, W., Wen, Z., Microglia Colonization of Developing Zebrafish Midbrain Is Promoted by Apoptotic Neuron and Lysophosphatidylcholine, 214-22, Copyright (2016) with permission from Elsevier. Full text @ Dev. Cell