
- Title
-
Comparative Transcriptome Analysis Identifies CCDC80 as a Novel Gene Associated with Pulmonary Arterial Hypertension
- Authors
- Sasagawa, S., Nishimura, Y., Sawada, H., Zhang, E., Okabe, S., Murakami, S., Ashikawa, Y., Yuge, M., Kawaguchi, K., Kawase, R., Mitani, Y., Maruyama, K., Tanaka, T.
- Source
- Full text @ Front Pharmacol
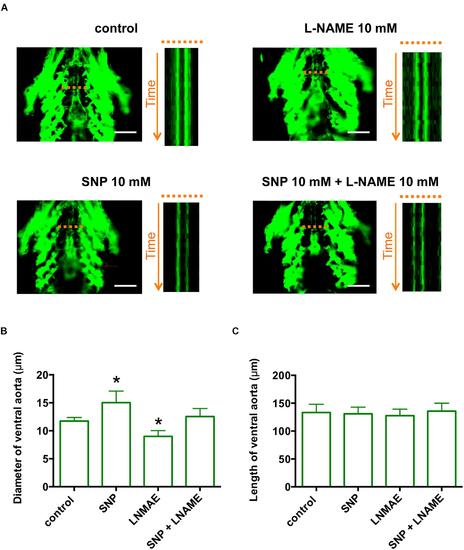
The zebrafish ventral artery diameter is increased by a NO donor and decreased by a NO synthase inhibitor. (A) In vivo imaging of the ventral artery of Tg (fli1:EGFP) zebrafish at 6 dpf. Zebrafish were incubated with or without 10 mM Sodium nitroprusside (SNP) and/or 10 mM L-NAME for 2 h and then placed on microscope slides on their backs. The ventral artery was imaged under a fluorescent microscope at 100 frames/s for 5 s. The image stack projections and time-lapse imaging traces at the level of the ventral artery (dotted lines) are shown. Scale bars, 100 �m. (B) The diameter of the ventral artery was increased and decreased by zebrafish treatment with SNP and L-NAME, respectively, relative to untreated zebrafish. The ventral artery diameter of zebrafish co-treated with SNP and L-NAME was not significantly different from that of control zebrafish. The ventral artery diameters were measured using time-lapse imaging. N = 5 for each group. *p < 0.05 vs control. (C) The length of ventral artery in zebrafish treated with SNP and/or L-NAME was not significantly different compared to that in untreated zebrafish. N = 5 for each group. |
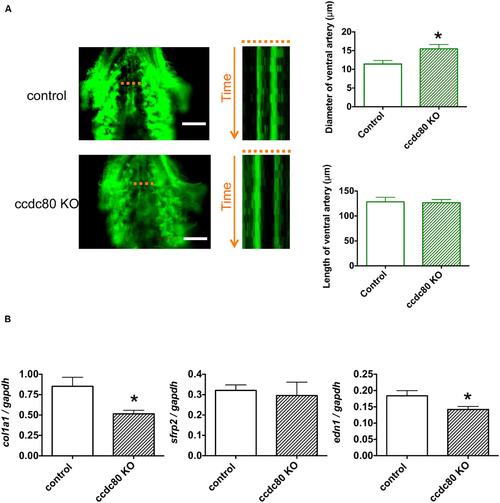
Knockout of ccdc80 causes ventral artery dilation and decreases col1a1 and edn1 expression in zebrafish. (A) In vivo imaging of the ventral artery of control and ccdc80 knockout Tg (fli1:EGFP) zebrafish at 6 dpf. Zebrafish were placed on slides on their backs, and the ventral artery was imaged under a fluorescence microscope at 100 frames/s for 5 s. Image stack projections and time-lapse imaging traces at the level of the ventral artery (dotted lines) are shown. Bar, 100 �m. The ventral artery diameter of the ccdc80 knockout zebrafish was significantly larger than that of control, whereas the length of ventral artery was not significantly different between groups. The upper right bar graph shows quantification of ventral artery diameters measured using time-lapse imaging. The lower right bar graph shows quantification of ventral artery lengths. N = 6 or 9 for the control and ccdc80 knockout groups, respectively. *p < 0.05 vs. control. (B) qPCR analysis of col1a1, sfrp2, and edn1 mRNA levels in control and ccdc80 knockout zebrafish at 6 dpf. Expression of col1a1, sfrp2, and edn1 was normalized to that of gapdh. N = 8 per group. *p < 0.05 vs. control groups. |