
- Title
-
Neural Mechanisms Generating Orientation Selectivity in the Retina
- Authors
- Antinucci, P., Suleyman, O., Monfries, C., Hindges, R.
- Source
- Full text @ Curr. Biol.
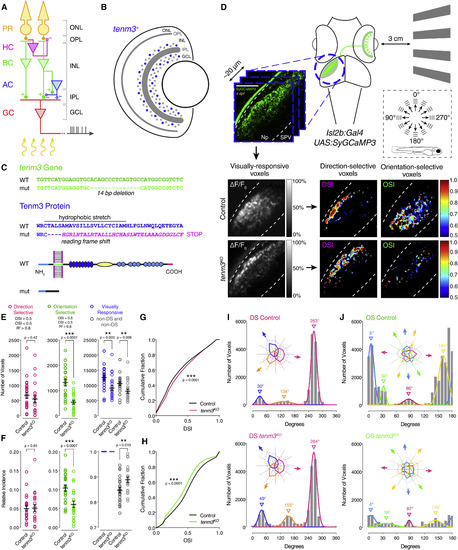
Tenm3 Is Required for RGC Orientation Selectivity (A) Basic neural circuit structure of the vertebrate retina. Cell classes are represented in colors, whereas layers are shown in black. Excitatory synapses are indicated by “+” (filled circles), inhibitory synapses are labeled with “-“ (empty circles). PR, photoreceptor; HC, horizontal cell; BC, bipolar cell; AC, amacrine cell; RGC, retinal ganglion cell; ONL, outer nuclear layer; INL, inner nuclear layer; GCL, ganglion cell layer; OPL, outer plexiform layer; IPL, inner plexiform layer. (B) Schematic showing tenm3 mRNA expression in the retina of zebrafish larvae. Blue circles indicate tenm3+ ACs and RGCs. Adapted from Antinucci et al. [17]. (C) TALEN-mediated tenm3 gene knockout (top) and consequent structural changes in the Tenm3 protein (bottom). (D) Functional calcium imaging of RGC axon terminals expressing SyGCaMP3 (green) in 4-dpf Tg(isl2b:Gal4;UAS:SyGCaMP3) larvae. Distance of right eye from projection screen is 3 cm. Recordings are performed from two to four Z-planes (approximately 20 µm total volume thickness) in the contralateral optic tectum. Dashed box shows the angles of moving bars relative to zebrafish larva orientation. Mean ΔF/F0 images of calcium recordings in control and tenm3KO larvae followed by mapping of DS and OS voxels are displayed. Np, neuropil; SPV, stratum periventriculare; DSI, direction selectivity index; OSI, orientation selectivity index. Scale bar, 40 µm. (E and F) Average number (E) and relative frequency (F) of DS, OS, visually responsive, and non-DS/non-OS voxels per Z-plane in control (n = 23 larvae) and tenm3KO (n = 22 larvae) 4-dpf larvae. Criteria used to identify DS and OS voxels are reported at the top. Error bars, ±SEM. **p < 0.01, ***p < 0.001, unpaired two-tailed Student’s t test. (G and H) Cumulative distributions of DSI values (R2 > 0) across voxels with OSI < 0.5 (G) and OSI values (R2 > 0) across voxels with DSI < 0.5 (H) in control and tenm3KO larvae. ***p < 0.001, two-sample Kolmogorov-Smirnov test. (I and J) Cumulative histograms summarizing the incidence of preferred angles for identified DS (I) and OS voxels (J) in control (n = 23; top) and tenm3KO (n = 22; bottom) 4-dpf larvae. Overlaid curves are the fitted Gaussian distributions for each DS or OS subtype. Polar plots illustrate the mean (+1 SD) normalized response profiles for each DS or OS subtype. See also Figure S1, Table S1, and Movie S1. |

IPL Stratification Pattern of Tenm3+ ACs and OSGCs (A) Schematic of the bacterial artificial chromosome (BAC) DNA construct used to transgenically express Gal4FF in tenm3+ cells. URE, upstream regulatory elements. (B and C) Inner plexiform layer (IPL) stratification pattern of tenm3+ AC neurites in control (B) and tenm3KO (C) Tg(tenm3:Gal4;UAS:tagRFP-CAAX) larvae from 2 to 5 dpf. INL, inner nuclear layer; GCL, ganglion cell layer. Scale bars, 20 µm. (D) IPL fluorescence intensity profiles of tenm3+ AC neurites in control (blue; n = 13 larvae) and tenm3KO larvae (red; n = 13 larvae) from 2 to 5 dpf. Thin traces represent individual IPL profiles, whereas thick traces indicate average IPL profiles. 0% corresponds to the INL/IPL boundary, whereas 100% corresponds to the IPL/GCL boundary. Fluorescence peaks indicating IPL strata in control larvae are labeled with the letter “S” followed by their relative IPL position. (E and F) Visual responses to moving bars (F) recorded through calcium imaging of an individual orientation-selective RGC (OSGC) axon terminal expressing GCaMP6f (E, green arrowhead) in the optic tectum of a 5-dpf UAS:GCaMP6f-injected Tg(isl2b:Gal4) larva. Polar plots show the integral responses to moving dark and light bars (F; dark and light green, respectively). Black and gray traces represent the ΔF/F0 calcium responses to moving dark and light bars, respectively. Np, neuropil; L, lateral; A, anterior; PO, preferred orientation. Scale bar, 40 µm. (G and H) Immunostaining for GCaMP6f (green) showing the dendritic morphology (G) of the functionally identified OSGC in (E) and the corresponding normalized IPL fluorescence intensity profile (H). Cell bodies are labeled with the nuclear stain TO-PRO-3 (magenta). Scale bar, 20 µm. (I) IPL fluorescence intensity profiles of OSGCs (green; n = 5 cells) and tenm3+ AC neurites (blue; n = 13 larvae) at 5 dpf. 12.8% of functionally imaged RGCs were OS (five out of 39 cells in 39 larvae). Thin traces represent individual IPL profiles, whereas thick traces indicate average IPL profiles. Fluorescence peaks indicating IPL strata formed by OSGC dendrites are labeled with the letter “S” followed by their relative IPL position. See also Figures S2 and S3 and Movie S2. |

IPL Stratification Pattern of Tenm3+ ACs and OSGCs (A) Schematic of the bacterial artificial chromosome (BAC) DNA construct used to transgenically express Gal4FF in tenm3+ cells. URE, upstream regulatory elements. (B and C) Inner plexiform layer (IPL) stratification pattern of tenm3+ AC neurites in control (B) and tenm3KO (C) Tg(tenm3:Gal4;UAS:tagRFP-CAAX) larvae from 2 to 5 dpf. INL, inner nuclear layer; GCL, ganglion cell layer. Scale bars, 20 µm. (D) IPL fluorescence intensity profiles of tenm3+ AC neurites in control (blue; n = 13 larvae) and tenm3KO larvae (red; n = 13 larvae) from 2 to 5 dpf. Thin traces represent individual IPL profiles, whereas thick traces indicate average IPL profiles. 0% corresponds to the INL/IPL boundary, whereas 100% corresponds to the IPL/GCL boundary. Fluorescence peaks indicating IPL strata in control larvae are labeled with the letter “S” followed by their relative IPL position. (E and F) Visual responses to moving bars (F) recorded through calcium imaging of an individual orientation-selective RGC (OSGC) axon terminal expressing GCaMP6f (E, green arrowhead) in the optic tectum of a 5-dpf UAS:GCaMP6f-injected Tg(isl2b:Gal4) larva. Polar plots show the integral responses to moving dark and light bars (F; dark and light green, respectively). Black and gray traces represent the ”F/F0 calcium responses to moving dark and light bars, respectively. Np, neuropil; L, lateral; A, anterior; PO, preferred orientation. Scale bar, 40 µm. (G and H) Immunostaining for GCaMP6f (green) showing the dendritic morphology (G) of the functionally identified OSGC in (E) and the corresponding normalized IPL fluorescence intensity profile (H). Cell bodies are labeled with the nuclear stain TO-PRO-3 (magenta). Scale bar, 20 µm. (I) IPL fluorescence intensity profiles of OSGCs (green; n = 5 cells) and tenm3+ AC neurites (blue; n = 13 larvae) at 5 dpf. 12.8% of functionally imaged RGCs were OS (five out of 39 cells in 39 larvae). Thin traces represent individual IPL profiles, whereas thick traces indicate average IPL profiles. Fluorescence peaks indicating IPL strata formed by OSGC dendrites are labeled with the letter “S” followed by their relative IPL position. See also Figure S4, Table S1, and Movie S3. |
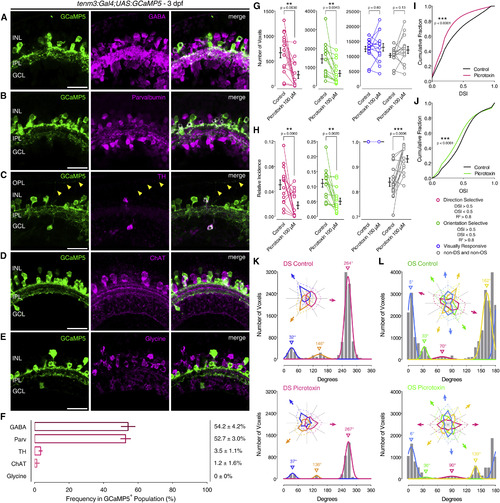
Role of Tenm3+ AC GABAergic Inhibition in RGC Orientation Selectivity (A-E) Immunostaining showing the expression of γ-aminobutyric acid (GABA; A), parvalbumin (B), tyrosine hydroxylase (TH; C), choline acetyltransferase (ChAT; D), and glycine (E) (all in magenta) in 3-dpf Tg(tenm3:Gal4;UAS:GCaMP5) larvae, where tenm3+ ACs are labeled with GCaMP5 (green). Yellow arrowheads indicate neurites of TH+ interplexiform ACs (C). INL, inner nuclear layer; GCL, ganglion cell layer; OPL, outer plexiform layer; IPL, inner plexiform layer. Scale bars, 20 µm. (F) Percentage of GCaMP5+ cells co-localizing with antigen+ cells (mean ± SD). GABA, n = 13 retinae; Parvalbumin, n = 10 retinae; TH, n = 9 retinae; ChAT, n = 10 retinae; glycine, n = 5 retinae. (G and H) Average number (G) and relative frequency (H) of DS, OS, visually responsive, and non-DS/non-OS voxels per Z-plane in 4-dpf Tg(isl2b:Gal4;UAS:SyGCaMP3) larvae (n = 15 larvae) before (control) and after (picrotoxin) the application of picrotoxin (100 µM). Error bars, ±SEM. **p < 0.01, ***p < 0.001, paired two-tailed Student’s t test. (I and J) Cumulative distributions of DSI values (R2 > 0) across voxels with OSI < 0.5 (I) and OSI values (R2 > 0) across voxels with DSI < 0.5 (J) before (control) and after (picrotoxin) the application of picrotoxin (100 µM). ***p < 0.001, two-sample Kolmogorov-Smirnov test. (K and L) Cumulative histograms summarizing the incidence of preferred angles for identified DS (K) and OS voxels (L) in 4-dpf larvae (n = 15 larvae) before (control) and after (picrotoxin) the application of picrotoxin (100 µM). Overlaid curves are the fitted Gaussian distributions for each DS or OS subtype. Polar plots illustrate the mean (+1 SD) normalized response profiles for each DS or OS subtype. See also Figure S5 and Table S1. EXPRESSION / LABELING:
PHENOTYPE:
|
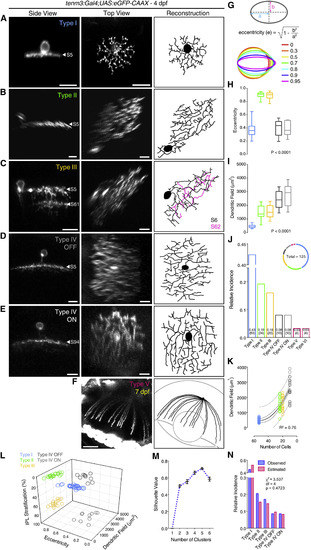
Morphological Diversity of Individual Tenm3+ AC Types (A-F) Morphologies of single tenm3+ ACs expressing eGFP-CAAX in 4-dpf UAS:eGFP-CAAX-injected Tg(tenm3:Gal4) larvae. The side views (left), top views (middle), and top view 3D reconstructions (right) are shown. IPL strata location of tenm3+ AC neurites is indicated by the letter “S” followed by the relative IPL position. The 3D reconstructed neurites of the bi-stratified type III tenm3+ AC are color-coded according to the stratum they are located. Note that the type V tenm3+ AC shown in (F) is from a 7-dpf larva. Scale bars, 10 µm in (A)-(E) and 40 µm in (F). (G) Diagram illustrating the quantification of dendritic field elongation by calculating the eccentricity of dendritic arbor profiles following ellipse fitting. “a” is the length of the semi-major axis, and “b” is the length of the semi-minor axis. (H-J) Dendritic field elongation (i.e., eccentricity; H), dendritic field area (I), and relative frequency (J) of identified tenm3+ AC types (n = 125 cells from 65 larvae). The number of observed cells for each tenm3+ AC type is reported in brackets (J). Boxplots indicate interquartile ranges (boxes), medians (lines in boxes), and ranges (min-max, whiskers). p values are the results of one-way ANOVA. (K) Relationship between dendritic field area of type I-IV tenm3+ ACs and their observed frequency (in number of cells). The continuous curve shows the nonlinear regression of the data with a second order polynomial function indicating a quadratic relationship between the two variables. Thick and thin dashed curves report the 95% confidence and prediction bands of the nonlinear fit, respectively. Goodness of fit value (R2) is reported at the bottom-right corner. (L and M) k-means clustering of type I-IV tenm3+ ACs based on their IPL stratification, dendritic field area, and dendritic field elongation. Individual cell data points are color coded according to which tenm3+ AC type they have been classified (L). Analysis of mean silhouette values for increasing number of clusters indicates that five clusters best describe the dataset (M). Importantly, the five cell clusters obtained by k-means are consistent with the classification of the most frequent tenm3+ ACs into five different types. Error bars, ±SEM. (N) Observed (blue) and estimated (red; assuming a retinal coverage factor of 1) relative frequencies of type I-IV tenm3+ ACs. Results of the two-tailed chi-square test are reported. See also Table S1. |

Orientation Selectivity in Tenm3+ ACs and BC Terminals (A) Two-photon functional calcium imaging of tenm3+ AC synaptic terminals expressing SyGCaMP3 (green) in 4-dpf Tg(tenm3:Gal4;UAS:SyGCaMP3) larvae. Distance of the eye from LCD screen is 2 cm. Recordings are performed from two to four Z-planes (approximately 20 µm total volume thickness). INL, inner nuclear layer; GCL, ganglion cell layer; IPL, inner plexiform layer. Scale bar, 20 µm. (B) Cumulative histogram summarizing the incidence of preferred angles for identified tenm3+ AC OS voxels in 4-dpf larvae (n = 20 larvae). Overlaid curves are the fitted Gaussian distributions for each OS subtype. Polar plots illustrate the mean (+1 SD) normalized response profiles for each OS subtype. (C-E) Degree of orientation selectivity (quantified by the OSI) across voxels with DSI < 0.5 and R2 > 0 in tenm3+ ACs (blue, n = 20 larvae), BCs (green, n = 20 larvae), and RGCs (red, n = 23 larvae; data from Figure 1H). Boxplots in (C) indicate interquartile ranges (boxes), medians (lines in boxes), and 10-90 percentiles (whiskers). The black dotted lines in (D) and (E) indicate the OSI threshold used to identify OS responses (OSI > 0.5). (F) Bar histogram summarizing the frequency of OS cells among tenm3+ ACs in 4-dpf Tg(tenm3:Gal4) larvae injected with UAS:GCaMP6f DNA constructs (n = 29 cells from 27 larvae). The number of observed OS cells for each tenm3+ AC type is reported at the bottom. nf, not found. (G) Scatterplot representing the relationship between OSI and dendritic field eccentricity of OS type II and III tenm3+ ACs (II, n = 5 cells; III, n = 3 cell). Spearman’s correlation coefficient (r) with the corresponding p value is reported. Dotted line represents the linear regression fit to the data. (H) Scatterplot representing the relationship between preferred stimulus orientation and dendritic field orientation of OS type II and III tenm3+ ACs (II, n = 5 cells; III, n = 3 cell). Spearman’s correlation coefficient (r) with the corresponding p value is reported. Dotted reference line indicates x = y. Top graph shows the angular difference between preferred stimulus orientation and dendritic field orientation (mean ± SD). (I) Normalized frequency distributions of preferred stimulus orientations in OS tenm3+ ACs (blue, n = 20 larvae), BCs (green, n = 20 larvae), and RGCs (red, n = 23 larvae; data from Figure 1J). The Gaussian distributions of the four different OS subpopulations are reported in separate graphs. (J) Relative proportions of the four different OS subpopulations (Pop 1-4) in tenm3+ ACs (blue), BCs (green), and RGCs (red). Values are obtained by calculating the relative proportion (%) of the area under the normalized Gaussian curves in (I). (K) Correlation matrix showing Spearman’s correlation coefficients (r) between the frequency distribution of the four OS subpopulations in tenm3+ ACs, BCs, and RGCs. (L) Two-photon functional calcium imaging of BC ribbon synapses expressing SyGCaMP6 (green) in 4-dpf Tg(-1.8ctbp2:SyGCaMP6) larvae. Distance of the eye from LCD screen is 2 cm. Recordings are performed from two to four Z-planes (approximately 20 µm total volume thickness). Scale bar, 20 µm. (M) Cumulative histogram summarizing the incidence of preferred angles for identified BC OS voxels in 4-dpf larvae (n = 20 larvae). Overlaid curves are the fitted Gaussian distributions for each OS subtype. Polar plots illustrate the mean (+1 SD) normalized response profiles for each OS subtype. (N-P) Examples of visual responses to moving gratings from two BC terminals. Images showing the mean fluorescence across tuning experiments with identified regions of interest (ROIs) are reported in (N). (O) shows calcium responses of the two ROIs in (N) with black traces representing the average responses across three trials (gray traces) for each stimulus epoch. Polar plots in (P) illustrate the mean response profile (±SD, dotted lines) of each ROI with corresponding OSI, DSI, and R2 values. Note that ROI #1 shows orientation selectivity. Scale bar, 5 µm. See also Figures S6 and S7, Table S1, and Movies S4 and S5. EXPRESSION / LABELING:
|

Tenm3 Knock-out, Quantification of Direction and Orientation Selectivity, and Tenm3 Functional Role in Late Development, Related to Figure 1 and Movie S1. (A and B) TALEN-mediated tenm3 gene knock-out (A) and consequent structural changes in the Tenm3 protein (B). DNA sequencing chromatograms show the 14-base pair (bp) deletion present in tenm3KO mutant (mut) larvae. This deletion in the gene region encoding the transmembrane domain of Tenm3 generates a reading frame shift and subsequent premature stop codon, therefore leading to the production of a non-functional Tenm3 protein missing its entire extracellular domain. (C and D) Immunostaining showing the expression of Tenm3 (green) in retinae of 3-dpf WT (C) and tenm3KO larvae (D). Cell bodies are labelled with the nuclear stain TO-PRO-3 (magenta). D, dorsal; L, lateral. Scale bars are 40 µm. (E and F) Insets in (C) and (D) showing that, in the WT retina (E), Tenm3 is expressed in the inner nuclear layer (INL) and ganglion cell layer (GCL), whereas no Tenm3 expression is present in the tenm3KO retina (F). IPL, inner plexiform layer. Scale bars are 20 µm. Importantly, all images in (CF) were obtained using the same acquisition settings. (G) Diagram illustrating the quantification of direction selectivity (left) and orientation selectivity (right) using the direction selectivity index (DSI) and orientation selectivity index (OSI), respectively. The algorithms used to calculate DSI and OSI of visual responses are reported at the top. For DSI, the responses to the preferred direction of moving bars (Rpref) and opposite, or null, direction (Rnull; 180° angular distance) are used. For OSI, the responses to the preferred axis (Rpref) and orthogonal axis (Rorth; 90° angular distance) are used. Note that the arrows indicate the motion direction of orthogonally oriented bars or gratings. A single Gaussian or von-Mises distribution is used to fit responses of direction-selective cells and estimate their preferred direction of motion from the centre of the fitted curve. The sum of two Gaussian or von-Mises distributions (180° angular distance apart) is used to fit responses of orientation-selective cells in order to estimate their preferred axis and stimulus orientation from the centres of the fitted curves. The colour code describes the different levels of direction (left) and orientation (right) selectivity. (H and I) Average number (H) and relative frequency (I) of DS, OS, visually responsive and non- DS/non-OS voxels per Z-plane in control (n = 12 larvae) and tenm3KO (n = 13 larvae) 7-dpf Tg(isl2b:Gal4;UAS:SyGCaMP3) larvae. Error bars are ± SEM. *p < 0.05, **p < 0.01, unpaired twotailed Student’s t test. (J and K) Cumulative distributions of DSI values (R2 > 0) across voxels with OSI < 0.5 (J) and OSI values (R2 > 0) across voxels with DSI < 0.5 (K) in control and tenm3KO larvae. ***p < 0.001, twosample Kolmogorov-Smirnov test. (L and M) Cumulative histograms summarising the incidence of preferred angles for identified DS (L) and OS voxels (M) in control (n = 12; top) and tenm3KO (n = 13; bottom) 7-dpf larvae. Overlaid curves are the fitted Gaussian distributions for each DS or OS subtype. Polar plots illustrate the mean (+ 1 SD) normalised response profiles for each DS or OS subtype. EXPRESSION / LABELING:
PHENOTYPE:
|
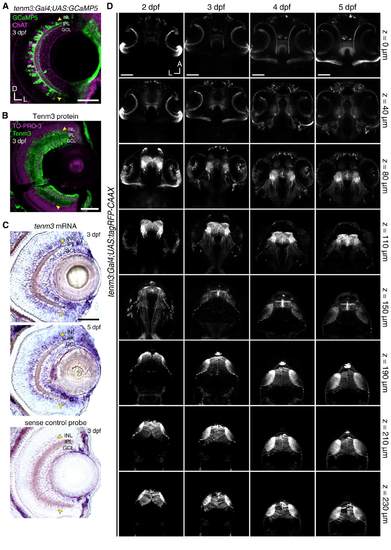
Tg(tenm3:Gal4) BAC Transgenic Labelling in the Retina and Brain, Related to Figure 2 and Movie S2. (A) Immunostaining showing tenm3 BAC transgenic labelling of a subset of amacrine cells in a 3- dpf Tg(tenm3:Gal4;UAS:GCaMP5G) larva. GCaMP5 expression is showed in green, whereas choline acetyltransferase (ChAT) expression is showed in magenta as a reference. Yellow arrowheads indicate tenm3+ amacrine cells in the inner portion of the inner nuclear layer (INL). GCL, ganglion cell layer; IPL, inner plexiform layer. D, dorsal; L, lateral. Scale bar is 40 µm. (B) Immunostaining showing the expression of Tenm3 (green) in the retina of a 3-dpf WT larva. Cell bodies are labelled with the nuclear stain TO-PRO-3 (magenta). Yellow arrowheads indicate Tenm3+ amacrine cells in the inner portion of the INL. Scale bar is 40 µm. (C) In situ hybridisations showing tenm3 mRNA expression in the retinae of 3- and 5-dpf WT larvae (top). A control in situ hybridisation at 3 dpf using sense tenm3 riboprobe is reported at the bottom. Yellow arrowheads indicate the inner portion of the INL. Scale bar is 40 µm. From Antinucci, et al. [S1]. (D) Overview of the brain regions labelled by the Tg(tenm3:Gal4;UAS:tagRFP-CAAX) BAC transgenic zebrafish line from 2 to 5 dpf. Eight Z-planes are displayed per developmental stage (approximately 230 µm total volume thickness). The most ventral regions (z = 0 µm) are displayed at the top, whereas the most dorsal ones (z = 230 µm) are at the bottom. Note that tagRFP-CAAX is expressed in the retina (0-80 µm Z-axis depth), thalamus (80-150 µm Z-axis depth), and optic tectum (150-230 µm Z-axis depth), which are brain regions where tenm3 is highly expressed. A, anterior; L, left. Scale bars are 100 µm. |
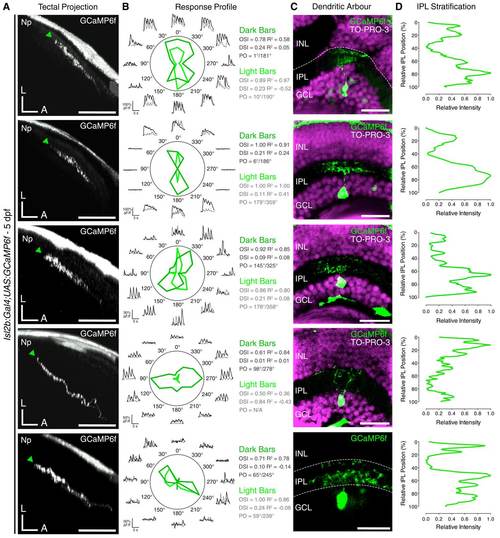
IPL Dendritic Stratification Pattern of Individual OSGCs, Related to Figure 2. (A) Side views of axon projections (green arrowheads) of individual OSGCs expressing GCaMP6f in the optic tectum of 5-dpf UAS:GCaMP6f-injected Tg(isl2b:Gal4) larvae. 12.8% of functionally imaged RGCs were OS (5 out of 39 cells in 39 larvae). Np, neuropil; A, anterior; L, lateral. Scale bars are 40 µm. (B) Functional identification of individual OSGCs through analyses of their visual responses to moving bars. Polar plots represent the tuning profiles (obtained by calculating the integral response to each stimulus) of OSGCs for dark and light moving bars (dark and light green, respectively). Black and grey traces represent the ΔF/F0 calcium responses to moving dark and light bars, respectively. OSI, orientation selectivity index; DSI, direction selectivity index; R2, Gaussian goodness of fit; PO, preferred orientation. (C and D) Immunostaining for GCaMP6f (green) showing the dendritic morphology of functionally identified OSGCs (C) and corresponding normalised IPL fluorescence intensity profiles (D). 0% corresponds to the INL/IPL boundary, whereas 100% corresponds to the IPL/GCL boundary. Cell bodies are labelled with the nuclear stain TO-PRO-3 (magenta). INL, inner nuclear layer; GCL, ganglion cell layer; IPL, inner plexiform layer. Scale bars are 20 µm. |

Optogenetic Ablation of Tenm3+ ACs using KillerRed, Related to Figure 3 and Movie S3. (A) Schematic summarising the experimental procedure used to validate the optogenetic ablation of tenm3+ ACs. At 2 dpf, the eyes of Tg(tenm3:Gal4;UAS:KillerRed) and Tg(tenm3:Gal4) control larvae were illuminated with intense green light (540-552 nm) for 40 minutes using a wide-field fluorescence microscope equipped with a 40× objective. After 3-4 hours, the larvae were fixed in 4% paraformaldehyde (PFA) at 4°C overnight (O/N). Subsequently, larvae were cryosectioned and fluorometric terminal deoxynucleotidyl transferase dUTP nick end labeling (TUNEL) assays were performed on sections following standard protocols. (B) TUNEL staining (green) shows the presence of apoptotic nuclei characteristic of dying cells in the retinae of 2-dpf Tg(tenm3:Gal4;UAS:KillerRed) larvae following 40 minutes of green light illumination (top, n = 3 larvae). In these larvae KillerRed (magenta) is selectively expressed in tenm3+ ACs. White arrowheads indicate the sites of co-localisation between KillerRed+ cell bodies and TUNEL+ apoptotic nuclei in the inner nuclear layer (INL). Importantly, no cell death is detected in the retinae of 2-dpf Tg(tenm3:Gal4) control larvae that were subjected the same illumination procedure (bottom, n = 3 larvae). In the bottom panel, cell bodies are labelled with the nuclear stain TO-PRO-3 (magenta). GCL, ganglion cell layer; IPL, inner plexiform layer. Scale bars are 20 µm. (C) Proof-of-principle experiment showing the effects of 15 minutes illumination with green light on the KillerRed (magenta) fluorescence level (F) in the retina of a 3-dpf Tg(tenm3:Gal4; UAS:KillerRed;elavl3:GCaMP5G) larva. Strikingly, strong photobleaching (~90% decrease in fluorescence) is observed after green light illumination, indicating effective KillerRed phototoxicity. This large decrease in KillerRed fluorescence is visible even one day after illumination. No significant decrease in the overall GCaMP5G fluorescence (green) is detected after illumination. Importantly, all images were obtained using the same acquisition settings. Scale bars are 20 µm. (D) Inset of (C) showing the dramatic morphological changes of a single KillerRed-expressing tenm3+ AC (yellow arrowhead) following green light illumination. Notably, also the GCaMP5G fluorescence appears to decrease in this cell, probably due to the production of phototoxic reactive oxygen species in the cytoplasm. The magenta channel signal has been increased post-acquisition to compensate for the ~90% decrease in fluorescence resulting from the illumination procedure. Scale bars are 10 µm. |

Functional Imaging, Dendritic Field Orientation and Neurotransmitter Identity of Single Tenm3+ ACs, Related to Figure 6. (A) Summary of morphological and functional analyses of single GCaMP6f-labelled tenm3+ ACs in 4-dpf UAS:GCaMP6f-injected Tg(tenm3:Gal4) larvae. An example of a type II tenm3+ AC that showed stimulus-locked responses and high orientation selectivity is displayed. Left: morphological reconstruction of the cell (grey, top view) with corresponding fitted ellipse profile (green) and dendritic field (DF) orientation (black line). Scale bar is 20 µm. Middle: Polar plot representing the tuning profile of the cell (green, obtained by calculating the integral response to each stimulus) in response to gratings moving in different directions. Grey line indicates preferred stimulus orientation (Pref Stim Ori). Radial axis scale shows ΔF/F0 of integral calcium responses. Right: Tuning profile (green) with fitted sum of two Gaussians (dotted black line). Measurements of morphological and functional characteristics of the example cell are reported on the right. R2, goodness of fit of the sum of two Gaussians distribution. (B) Retinal location mapping of individual eGFP-CAAX-labelled type II (green, top) and type III (yellow, bottom) tenm3+ ACs in 4-dpf UAS:eGFP-CAAX-injected Tg(tenm3:Gal4) larvae (n = 24 and 20 cells in 39 larvae, respectively). Frequencies of type II and III tenm3+ ACs in number of cells per retinal quadrant or hemiretina are reported on the right. D, dorsal; V, ventral; N, nasal; T, temporal. (C) Grouped data summarising dendritic field orientation and elongation (quantified by the eccentricity of dendritic fields; radial axis) of individual eGFP-CAAX-labelled type II (green, top) and type III (yellow, bottom) tenm3+ ACs (n = 24 and 20 cells in 39 larvae, respectively). Radial axis scale of the polar plots shows the eccentricity of dendritic fields. Frequencies of type II and III tenm3+ ACs in number of cells per orientation (20° bin width; 0°-180° orientation space) are reported on the right. (D) Mosaically labelled tenm3+ ACs expressing eGFP in 4-dpf UAS:eGFP-injected Tg(tenm3:Gal4) larvae. Both side views (left) and top views (right) are shown. Scale bars are 20 µm. (E) Immunostaining showing the expression of γ-aminobutyric acid (GABA; magenta) in the identified eGFP-expressing tenm3+ ACs (green) reported in (D). Arrowheads are colour-coded according to the tenm3+ AC type each cell is classified into. Note that both type II (green arrowheads) and type III (yellow arrowheads) tenm3+ ACs express the neurotransmitter GABA. Interestingly, type I tenm3+ ACs (cyan arrowheads) do not appear to express GABA. Note that the merged images (right) have been enlarged by the reported magnification factors to help visualisation. Scale bars are 20 µm. |