
- Title
-
Visualization of Neuregulin 1 ectodomain shedding reveals its local processing in vitro and in vivo
- Authors
- Kamezaki, A., Sato, F., Aoki, K., Asakawa, K., Kawakami, K., Matsuzaki, F., Sehara-Fujisawa, A.
- Source
- Full text @ Sci. Rep.
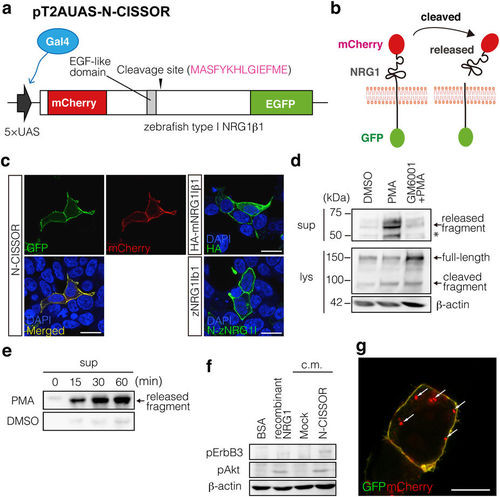
Generation of N-CISSOR probe. (a) N-CISSOR, type-I zebrafish NRG1β1 (zNRG1Iβ1) constructed with an extracellular mCherry and an intracellular GFP, was expressed under the control of a 5× UAS sequence, which was driven by Gal4. (b) N-CISSOR was designed to monitor intramolecular NRG1 cleavage, which resulted in physical separation of mCherry and GFP. Ectodomain-shedding activities were assessed as relative values of the mCherry/GFP ratios. (c) Cellular localization of N-CISSOR expressed in HEK293T cells compared with those of immunodetected HA-mNRG1Iβ1 and unlabelled zNRG1Iβ1. Scale bar: 20 μm. (d,e) Western blot analysis of N-CISSOR dynamics. Released (1st panel) and full-length (2nd panel) N-CISSOR fragments were detected using anti-mCherry and anti-GFP antibodies, respectively. β-actin was detected as an internal control (3rd panel). An asterisk shows the extra bands produced by the intramolecular cleavage of mCherry during the denaturation procedure. (d) Metalloprotease-dependent N-CISSOR cleavage induced by PMA treatment for 20 min. Pre- and co-treatment with GM6001 for 30 min inhibited the PMA-induced release of ectodomain fragments. (e) Time-dependent N-CISSOR release induced by PMA treatment. The supernatants of N-CISSOR-expressing cells were harvested at the indicated time points after PMA or DMSO treatment. (f) Analysis of N-CISSOR bioactivity. Differentiated C2C12 myotubes were treated with conditioned medium from N-CISSOR-expressing cells or control cells. Recombinant NRG1 and its vehicle (BSA) were used as positive and negative controls, respectively. pErbB3 (185 kDa), pAkt (60 kDa), and β-actin (60 kDa) were detected in the lysates of C2C12 myotubes. (g) A merged image of GFP and mCherry in a N-CISSOR-expressing cell. Intracellular mCherry dots are indicated by arrows. Scale bar: 10 μm. |
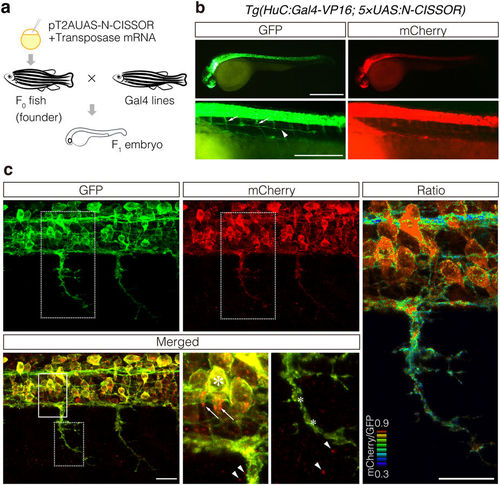
Expression of N-CISSOR in zebrafish. (a) Schematic representation of the procedure used for transgenesis and sample preparation. (b,c) Lateral view of the resulting F1 Tg (HuC:Gal4-VP16; 5 × UAS:N-CISSOR) embryo at 36 hpf under a fluorescence stereomicroscope (b) and a confocal microscope (c), showing N-CISSOR expression in the nervous system. (b) Spinal motor nerves and posterior lateral line are indicated by the arrows and arrowhead, respectively. Scale bar: 200 μm. (c) Maximum projection of z-stack images and views of magnified areas surrounded by solid and dotted borders are shown. High colocalization of GFP and mCherry in somas (large asterisk) and low colocalization in axons (small asterisks). Intracellular (arrows) and extracellular (arrowheads) accumulation of mCherry. The mCherry/GFP fluorescence ratio image is shown in the right column. Scale bar: 20 μm. |
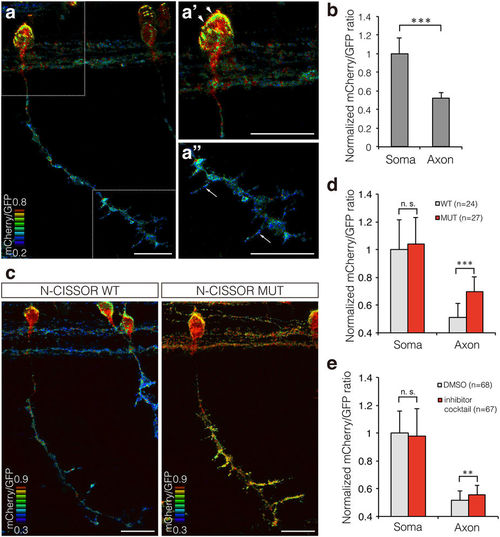
Single-cell analysis of N-CISSOR in zebrafish. (a) A representative mCherry/GFP ratio image of single CaP neurons in Tg (SAIGFF213A; 5 × UAS:N-CISSOR) embryo at 36 hpf. (a’,a”) Magnified views of (a), showing higher ratio in the surface of soma (arrowheads) and axonal branches (arrows). Scale bar: 20 μm. (b) Comparison of mCherry/GFP fluorescence ratios in somas and axons of single or coupled CaP neurons. The mCherry/GFP ratios were calculated for GFP-positive regions and normalized to the mean mCherry/GFP ratio observed in somas. The data are shown as the mean ± SD. P values were calculated by performing Student’s t-test. ***P < 0.0001. (c) Representative mCherry/GFP images of N-CISSOR (WT or MUT)-expressing CaP neurons at 36 hpf. Scale bar: 20 μm. (d) Normalized mCherry/GFP ratios in GFP-positive regions analysed in somas and axons from Tg (SAIGFF213A; 5 × UAS-N-CISSOR) and Tg (SAIGFF213A; 5 × UAS-N-CISSOR MUT) embryos at 36 hpf. The data shown are the mean ± SD. P values were calculated by performing Student’s t-test. ***P < 0.0001. (e) Normalized mCherry/GFP ratios in GFP-positive regions analysed in somas and axons of single or coupled CaP neurons in Tg (SAIGFF213A; 5 × UAS-N-CISSOR) treated with a protease inhibitor cocktail (GM6001 and BACE inhibitor IV) or vehicle control (DMSO), at 25–36 hpf. The data shown are the mean ± SD. P values were calculated by performing Student’s t-test. **P < 0.001; ***P < 0.0001. See also Supplementary Fig. S3 and Supplementary Movie 4. |

Inhibition of N-‐CISSOR cleavage in zebrafish embryos. (a) Representative image of Tg (SAIGFF213A; 5×UAS-‐N-‐CISSOR MUT) at 36 hpf. Scale bar: 10 μm. (b) Western blot analysis of the inhibition of N-‐CISSOR cleavage following treatment with an inhibitor cocktail (0.5 μM GM6001 and 0.1 μm BACE inhibitor IV; dissolved in DMSO) for 4 h. f. l.: full-‐length; c. f.: cleaved fragment. (c) GFP image of CaP neurons in Tg (SAIGFF213A; 5×UAS-‐N-‐CISSOR) treated with an inhibitor cocktail (0.5 mM GM6001 and 0.1 mM BACE inhibitor IV; dissolved in DMSO) obtained between 25 and 36 hpf. Scale bar: 20 μm |