
- Title
-
Quantitative in vivo optical tomography of cancer progression & vasculature development in adult zebrafish
- Authors
- Kumar, S., Lockwood, N., Ramel, M.C., Correia, T., Ellis, M., Alexandrov, Y., Andrews, N., Patel, R., Bugeon, L., Dallman, M.J., Brandner, S., Arridge, S., Katan, M., McGinty, J., Frankel, P., French, P.M.
- Source
- Full text @ Oncotarget
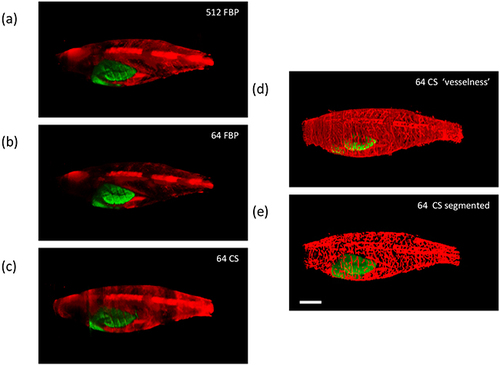
Exemplar reconstructed OPT images of adult [81 days post fertilization (dpf)] TraNac Tg (KDR:m Cherry:Fabp10-rtTA:TRE-eGFPKRASV12) zebrafish expressing liver specific eGFP-labelled tumour and mCherry-labelled vasculature showing maximum intensity projections of eGFP (green) and mCherry (red) fluorescence (scale bar = 2.5 mm). a. and b. show FBP reconstructed images computed with 512 and 64 projections respectively, c. shows the corresponding image reconstructed from 64 projections using the CS-OPT approach, d. shows the “vesselness” of the same reconstruction and e. shows the “final” segmented image of the vasculature. See Supplementary Video S1 for corresponding 3-D animations. EXPRESSION / LABELING:
PHENOTYPE:
|
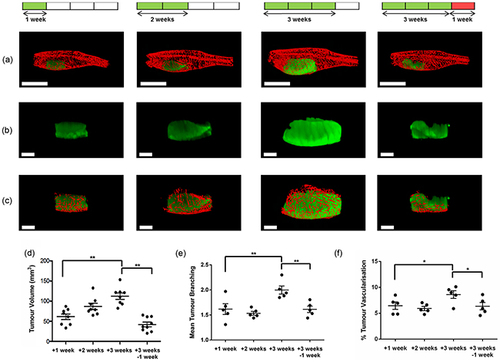
a-c. Representative “final” segmented reconstructed CS-OPT images of eGFP-labelled tumour and mCherry-labelled vasculature in adult TraNac Tg (KDR:mCherry;Fabp10:rtTA;TRE:eGFP:KRASV12) zebrafish with data acquired following DOX treatment at 145 dpf after one, two and three weeks of treatment and after three weeks of DOX treatment plus a further week with no treatment (See also Supplementary Videos S2-S3). (a) shows whole images of tumour and vasculature (scale bar = 5 mm); (b) and (c) show the corresponding CS-OPT images (scale bar = 2 mm) of the of the tumour alone and of the segmented vasculature associated with the tumour. d, e, f. respectively are graphs plotting the corresponding variation of the mean tumour volume, the mean number of tumour vessel branch points and percent tumour vascularisation (proportion of vasculature volume within tumour volume) calculated from this OPT data set, for which n≥5 at each condition and the error bars represent the standard error of the mean (SEM). *p<0.05, **p<0.01 as indicated by lines. |
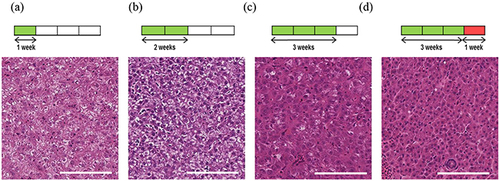
Induction and progression of HCC in adult TraNac Tg (KDR:mCherry:Fabp10-rtTA:TRE-eGFPKRASV12) zebrafish. Images of H&E stained representative tumour sections following tumour induction for a. one week, b. two weeks and c. three weeks with d. imaged after three weeks of induction plus a further week after removal of inducer treatment. Each group (n=6-8) Scale bars 100 μm. PHENOTYPE:
|
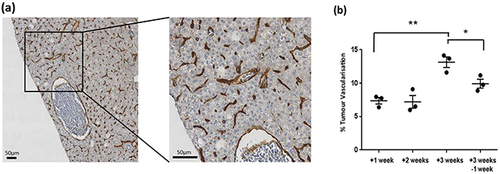
a. Representative IHC mCherry staining showing vessels (brown) from three week tumour induced adult TraNac Tg (KDR:mCherry:Fabp10-rtTA:TRE-eGFPKRASV12) zebrafish. Scale bar 50μm. b. Graph showing IHC mCherry quantitative analysis of percent vessel coverage over regions of interest. Each group (n =3) and error bars represent the SEM. *p<0.05, **p<0.01 as indicated by lines. |
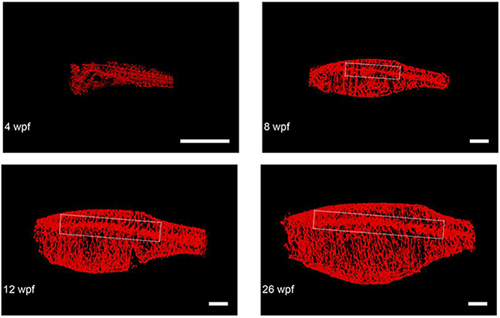
Representative final reconstructed CS-OPT images from a longitudinal study of an individual TraNac Tg (KDR:mCherry) zebrafish re-imaged at 4, 8, 12 and 26 weeks post fertilisation (wpf). Inset boxes define the vascular region containing the lateral cutaneous artery and Table 1 summarises the quantification of key parameters of this developmental angiogenesis. (scale bar = 2 mm) (See also Supplementary Video S4). EXPRESSION / LABELING:
|
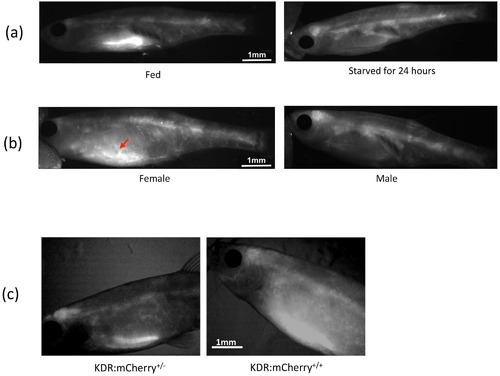
Fluorescent properties of adult TraNac Tg (KDR:mCherry:Fabp10-rtTA:TRE-eGFPKRASV12) zebrafish excited at 561nm. a. Wide-field fluorescence intensity images (acquired as individual OPT projections) of fed and starved zebrafish indicating auto fluorescence in the gut of fed zebrafish. b. Wide-field fluorescence intensity images of starved zebrafish indicating light scattering in abdomen due to eggs in female (arrow indicates scattering by the eggs). c. Wide field fluorescence microscope images of heterozygous (KDR:mCherry(+/-)) and homozygous (KDR:mCherry(+/+)) zebrafish. |
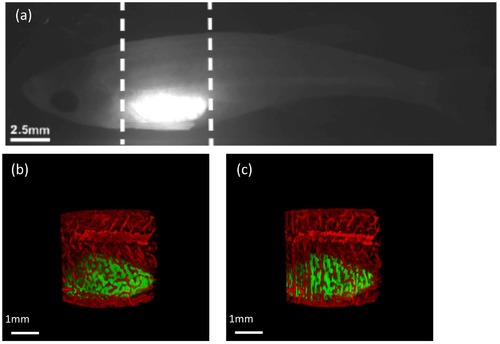
3-dimensional reconstructions of adult TraNac Tg (KDR:mCherry:Fabp10-rtTA:TREeGFPKRASV12) zebrafish after tumour induction using FBP and CS. a. Wide-field fluorescence intensity image (acquired as individual OPT projection) of tumour excited at 488 nm. b, c. Reconstructions of the tumour and vasculature (Hessian-based analysis) in the region indicated by dotted lines using (b) FBP with 512 Projections and (c) CS with 64 projections respectively. |
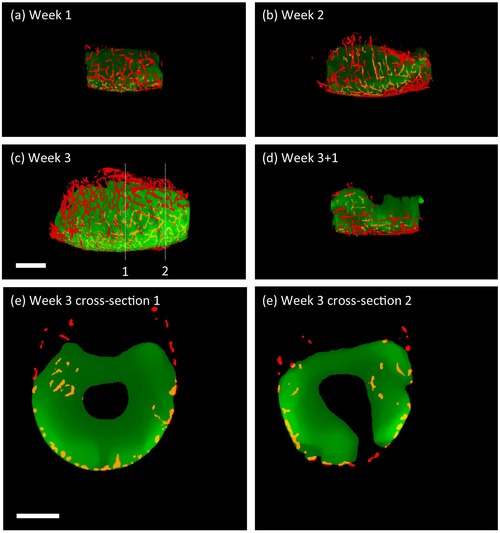
a-d. Representative “final” segmented reconstructed CS-OPT images of eGFP-labelled tumour and mCherry-labelled vasculature in adult TraNac Tg (KDR:mCherry;Fabp10:rtTA;TRE:eGFP:KRASV12) zebrafish with data acquired following DOX treatment at 145 dpf after (a) one, (b) two, (c) three weeks of treatment and (d) after three weeks of DOX treatment plus a further week with no treatment (See also Supplementary Video 3). e, f. Representative cross-sections showing tumour and vasculature from the reconstructed volume shown in (c) indicated by dotted lines 1 and 2 respectively. Red – vasculature ‘outside’ tumour, orange – vascular ‘inside’ tumour, green - tumour. Scale bar 2 mm. |