
- Title
-
aPKC regulates apical localization of Lgl to restrict elongation of microridges in developing zebrafish epidermis
- Authors
- Raman, R., Damle, I., Rote, R., Banerjee, S., Dingare, C., Sonawane, M.
- Source
- Full text @ Nat. Commun.

has/apkc function is important for restricting the length of microridges by preventing their precocious elongation. Immuno-colocalization using anti-aPKC antibody and phalloidin, which labels F-actin, in wild type and has/apkc mutant at 48 hpf (a) followed by colocalization coefficient analysis by Pearson’s (PC) method and Manders’ overlap for aPKC with F-actin (M1) and F-actin with aPKC (M2) at 48 hpf in wild-type embryos (b). Graphical representation (c) of apical surface area and total cell surface area in wild type and has/apkc mutant at 48 hpf. Visualization of the distribution of ridge lengths and medians in wild-type and aPKC-deficient embryos at various developmental time points using bean plots (d). The frequency distribution of ridges (e) in short (0-5 µm), intermediate (5-20 µm), long (20-100 µm) and very long (>100 µm) categories during development. Quantification in d and e are based on phalloidin stainings performed in wild-type and apkc morphants (f). Time-lapse imaging of microridges in clones expressing lifeActRFP under CMV promoter in wild-type and apkc morphants during 19-22 hpf and in has/apkc siblings (wild type) and mutants during 27-30 hpf (g). Error bars in c and e indicate s.d., whereas square brackets represent comparison. Probability values ‘P’ are for the Student’s t-test. Asterisks in the bean plot (d) represent significant difference in median values at P<0.05 as calculated by pairwise multiple comparison procedures using Dunn’s Method. Scale bars in a,f and g correspond to 10 µm. EXPRESSION / LABELING:
PHENOTYPE:
|

The levels of apical Lgl increase in the apical domain of the head peridermal cells in has/apkc mutants.Immunostaining using anti-Lgl2 and E-cadherin antibodies (a) in wild-type and has/apkc mutant embryos. Immuno-colocalization of Lgl and F-actin in the apical domain of wild-type and has/apkc mutant embryos at 48 hpf (b). Colocalization coefficient analysis between Lgl and F-actin by Pearson’s (PC) method and Manders’ overlap for Lgl with F-actin (M1) and F-actin with Lgl (M2) at 48 hpf in wild-type and has/apkc mutant embryos (c). Asterisks in c indicate significant difference at P<0.001 by Student’s t-test. Scale bar in a and b is equivalent to 10 µm. |

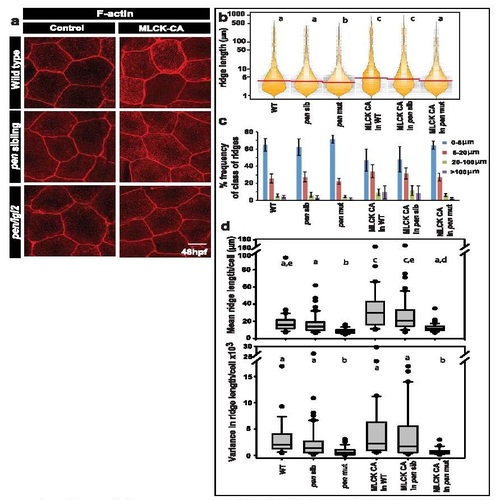
Lgl functions in the elongation of microridges in the apical domain.Immuno-localization of Lgl and F-actin in the apical domain of peridermal cells in given genetic conditions or morpholino injections at 48 hpf (a). Visualization of the distribution of ridge lengths and medians at 48 hpf, in various genetic conditions mentioned, using bean plots and horizontal lines, respectively (b) followed by estimation of percentage frequency distribution of ridges in short (0-5 µm), intermediate (5-20 µm), long (20-100 µm) and very long (>100 µm) categories (c). Estimation of mean and variance in ridge length for individual cells and comparison of the distributions of the means and variances across various genotypes using box-whisker plots (d). In b and d the distributions denoted by same alphabet or distributions that share an alphabet in common (when denoted by multiple alphabets) do not differ significantly (Dunn’s multiple comparisons test, P-value<0.05; see Methods section for details). In c s.d. is shown by error bars. Scale bar in a is equivalent to 10 µm. MO, morphant/morpholino; Std, standard. |
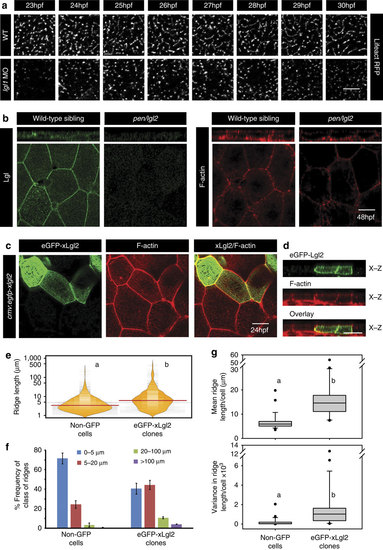
Lgl regulates the length of microridges by promoting their fusion.Live time-lapse imaging of microridge elongation (a) in clones expressing lifeActRFP under CMV promoter in wild-type and lgl1 morphant embryos during 23-30 hpf. Immunolocalization of Lgl and F-actin at the basolateral domain in wild-type and pen/lgl2 mutant at 48 hpf (b). Confocal images of immunostaining using anti-GFP antibody and phalloidin in wild-type embryos-injected with eGFP-xLgl2 construct under CMV promoter at 24 hpf (c) and their orthogonal sections (d). Visualization of the distribution of the ridge lengths and medians in eGFP-xLgl2 expressing clones and surrounding non-GFP cells using bean plots (e). The frequency distribution of ridges in short (0-5 µm), intermediate (5-20 µm), long (20-100 µm) and very long (>100 µm) categories (f). The box-whisker plots (g) represent the distributions of means and variances per cell in eGFP-xLgl2 expressing clones and surrounding non-GFP cells. Data presented in e-g is based on ridge-length measurements done on phalloidin stainings performed in the eGFP-xLgl2 injected embryos at 24 hpf. In bean plots (e) and box-whisker plots (g) the alphabets ‘a’ and ‘b’ represent significant difference in median values at P<0.05 (pairwise multiple comparison using Dunn’s Method). Error bars in f represent the s.d. Scale bars in a-d correspond to 10 µm. |

Microridge elongation in aPKC-deficient embryos occurs in an Lgl-dependent manner.Phalloidin stainings (a,d) at 48 hpf in genotypes mentioned. Ridge length estimation followed by visualization of the spread and frequency of their lengths and medians using bean plots (b,e). The frequency distribution of ridges (c,f) in short (0-5 µm), intermediate (5-20 µm), long (20-100 µm) and very long (>100 µm) categories across the above mentioned genotypes. In b and e the distributions sharing the same alphabet do not differ significantly (Dunn’s multiple comparisons test, P-value<0.05). Error bars in c and f represent the s.d. Scale bars in a and d corresponds to 10 µm. PHENOTYPE:
|

Apically localized Lgl promotes an increase in the microridge length. Confocal sections at the apical (z=2) and basolateral level (z=7) of the peridermal cells stained (a-c) for GFP and F-actin at 30 hpf in wild-type embryos injected with eGFP-mLgl1 (a) eGFP-Ezrin (b) and eGFP-Ezrin-mLgl1 (c) under CMV promoter along with their corresponding orthogonal sections. Visualization of the distribution of ridge lengths and medians-estimated from clones expressing eGFP-mLgl1 (d) eGFP-Ezrin (e) and eGFP-Ezrin-mLgl1 (f) and their corresponding non-GFP controls using bean plots. Comparison between the ridge lengths exhibited by clones expressing eGFP-Ezrin, eGFP-mLgl1 and eGFP-Ezrin-mLgl1 (g). The frequency distribution of ridges in short (0-5 µm), intermediate (5-20 µm), long (20-100 µm) and very long (>100 µm) categories for clones expressing eGFP-mLgl1 (d′), eGFP-Ezrin (e′) and eGFP-Ezrin-mLgl1 (f′) along with their corresponding non-GFP controls. The comparison between frequency distributions observed in clones expressing eGFP-Ezrin, eGFP-mLgl1 and eGFP-Ezrin-mLgl1 (g′). Quantifications in (d-g) and (d′-g′) are based on phalloidin stainings performed at 30 hpf in the embryos injected with the above mentioned eGFP constructs. Note the minimal localization of eGFP-Ezrin-mLgl1 and eGFP Ezrin to the basolateral cortex as compared with eGFP-Lgl1. The distributions represented by two different alphabets in d-g show significant difference at P<0.05 (Dunn’s multiple comparisons test). Error bars in (d′-g′) represent the s.d. Scale bars in a-c correspond to 10 µm. |
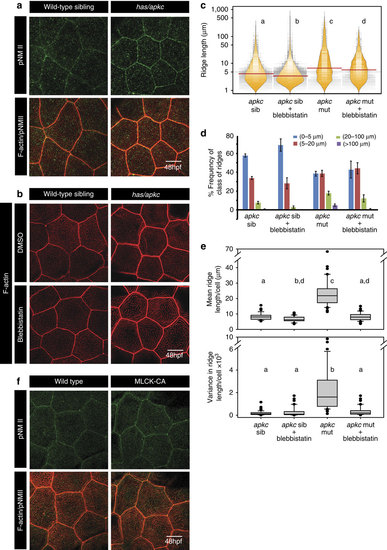
Activity of non-muscle myosinII (NMII) is essential and sufficient for elongation of microridges. Immuno-colocalization using anti pNMII antibody and phalloidin in wild-type and has/apkc mutant at 48 hpf (a). Wild-type and has/apkc mutant treated with 10 µM Blebbistatin at 48 hpf and stained using phalloidin to visualize F-actin (b). Graphical representation of the distribution of ridge lengths and medians of Blebbistatin treated and control embryos at 48 hpf using bean plots (c). The same data is presented as percentage frequency distribution of ridges in short (0-5 µm), intermediate (5-20 µm), long (20-100 µm) and very long (>100 µm) categories (d). Distribution of means and variances of ridge lengths (e) for individual peridermal cells- in wild-type sibling and has/apkc mutant treated with DMSO and Blebbistatin at 48 hpf-presented in box-whisker plots. Immuno-colocalization using anti pNMII antibody and phalloidin staining in wild-type embryos and embryos over-expressing constitutively active MLCK at 48 hpf (f). In c and e the distributions sharing the same alphabet do not differ significantly (Dunn’s multiple comparisons test, P-value<0.05). In ((e) top) the distributions for apkc sib and apkc sib+Blebbistatin are considered statistically significantly different at P=0.058. Error bars in d are for the s.d. Scale bars in a,b and f are equivalent to 10 µm. |
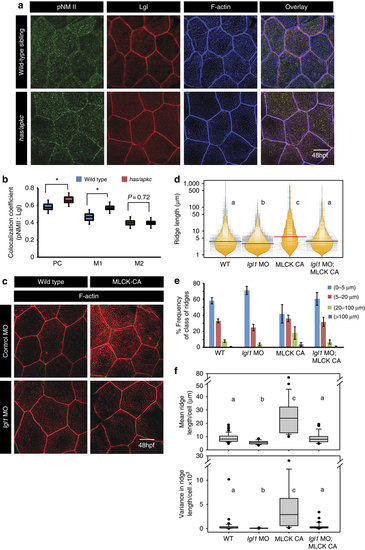
Both Lgl and active MyosinII are required to build long ridges. Immuno-colocalization using anti pNMII, anti-Lgl2 antibodies and phalloidin (a) in wild- type and has/apkc mutant at 48 hpf. Graphical representation (b) of colocalization coefficients for pNMII and Lgl by Pearson’s method and Manders’ overlap of pNMII with Lgl (M1) and Lgl with pNMII (M2) in wild-type and has/apkc mutant embryos at 48 hpf. Phalloidin stainings (c) in embryos injected with control morpholino, MLCK-CA+control morpholino, lgl1 morpholino and MLCK-CA+lgl1 morpholino at 48 hpf, followed by ridge length measurements and visualization of distribution of ridge lengths and medians using bean plots (d). The same data is presented as percentage frequency distribution of ridges in short (0-5 µm), intermediate (5-20 µm), long (20-100 µm) and very long (>100 µm) categories (e). The box-whisker plots (f) represent distributions of means and variances of ridge lengths for individual cells from various genetic conditions. In d and f, the distributions sharing the same alphabet do not differ significantly (Dunn’s multiple comparisons test, P-value<0.05). Error bars in e are for the s.d. Asterisks in b indicate significant difference at P<0.001 by Student’s t-test. Scale bars in a and c is equivalent to 10 µm. |

The loss of aPKC function and overexpression of MLCK-CA results in formation of Latrunculin resistant stable microridges. Phalloidin stainings of has/apkc sibling and mutant embryos (a) and wild type and MLCK-CA overexpression embryos (e) treated with Latrunculin A. Visualization of the spread and frequency of ridge lengths and medians from the given genotypes and treatments using bean plots (b,f). Estimation of percentage frequency distribution of ridges in short (0-5 µm), intermediate (5-20 µm), long (20-100 µm) and very long (>100 µm) categories (c,g). Estimation of cell wise means and variances of ridge lengths based on phalloidin stainings (d,h). In b,d,f and h, the distributions sharing the same alphabet do not differ significantly (Dunn’s multiple comparisons test, P-value<0.05). The two distributions in ((h) top), WT DMSO and MLCK-CA+LatA, are different at P=0.061. Error bars in c and g are for the s.d. Scale bars in a and e are equivalent to 10 µm. PHENOTYPE:
|
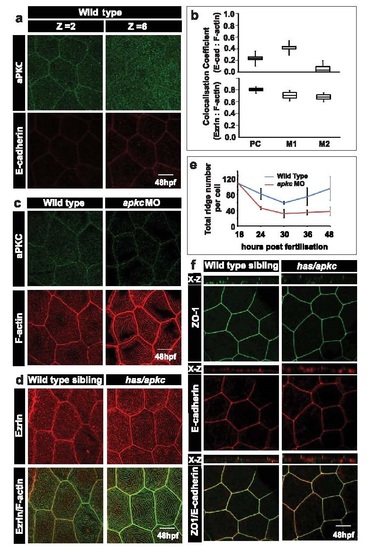
aPKC localises to the apical domain in peridermal cells but does not play a role in formation of cellular junctions. Immunostaining using anti-aPKC and E-cadherin antibodies (a) in wild-type embryos at 48hpf. Z=2 and Z=6 indicate the 2nd (apical) and the 6th (basolateral) confocal sections, respectively, from the apical side. Box-whisker plot for co-localisation coefficients (b; top) between E-cadherin and F-actin by Pearson’s method (PC) and Manders’ overlap of E-cadherin with F-actin (M1) and F-actin with E-cadherin (M2). Similar Pearson’s analysis (PC) between Ezrin and F-actin (b; bottom) and Manders’ overlap of Ezrin with F-actin (M1) and F-actin with Ezrin (M2) at 48hpf in wild-type embryos. Immuno-localisation using anti-aPKC antibody and phalloidin (c) in wild-type and apkc morphants at 48hpf. Immuno-localisation using anti-Ezrin antibody and phalloidin (d) in wild-type and has/apkc mutants at 48hpf. Quantification of total number of ridges (e) per peridermal cell during various developmental time points, based on phalloidin stainings performed in wild-type and apkc morphant embryos. Confocal images of stainings for ZO1 and E-cadherin in wild-type embryos and has/apkc mutants at 48hpf (f). X-Z are orthogonal sections. Basolateral marker E-cadherin does not localise to apical microridges (b) and serves as a negative control with Pearson coefficient=0.26+0.65. The E-cadherin antibody generates a few background speckles in the apical domain. Since some of these speckles fall on F-actin, it yields high Manders overlap coefficient of M1=0.413+0.14, which is misleading. However, F-actin shows very low overlap with E-cadherin background speckles yielding a very low Manders’ coefficient of M2=0.005+0.004. Ezrin serves as a positive control for correlation coefficient analysis. A major fraction of Ezrin localises with actin (b,d) giving rise to Pearson coefficient of 0.813+0.04. Similarly, Manders’ coefficients of Ezrin with F-actin (M1=0.73+0.09) and F-actin with Ezrin (M2=0.68+0.08) are high, reflecting significant overlap between Ezrin and F-actin (b,d). Scale bar = 10 µm. Abbreviations: PC- Pearson’s coefficient; M1 and M2- Manders overlap coefficients. |

Lgl co-localises with F-actin at microridges and exhibits temporal increase in its levels in aPKC deficient embryos. Lgl1 deficiency or Lgl2 overexpression does not perturb the overall polarity in the peridermal cells. Immuno-colocalisation using anti Lgl2 antibody and phalloidin (a) in wild-type and aPKC deficient embryos at 24hpf. Lgl2 staining in wild-type sibling and in has/apkc mutants at 32 and 48hpf (b). Confocal images along with orthogonal (X-Z) sections of ZO1 and E-cadherin stainings in wild-type embryos and lgl1 morphants at 48hpf (c). Immuno-localisation using anti aPKC and anti E-cadherin antibodies in clones expressing cmv:egfp-xlgl2 construct (d) at 30hpf. Scale bar = 10µm. |

Over-expression of heavy and light chains of MyosinII does not cause significant changes in ridge lengths. Confocal images of wild-type embryos injected with cmv:mhcII-gfp or cmv:mlcII-gfp and stained for GFP and F-actin at 30 hpf (a). Visualisation of the distribution of the ridge lengths and medians of the clones over-expressing cmv:mhcII-gfp or cmv:mlcII-gfp and the neighbouring non-GFP cells using bean plots (b). The percentage frequency distribution of ridges in short (0-5 µm), intermediate (5-20 µm), long (20-100 µm) and very long (>100 µm) categories (c), as well as estimation of mean and variance in ridge length for individual cells and comparison of their distributions (d) using box-whisker plots. Quantifications in (b), (c) and (d) are based on embryos injected with cmv:mhcII-gfp or cmv:mlcII-gfp and stained for GFP and F-actin at 30 hpf. Distributions represented with different alphabets show significant difference in median values at p<0.05 by pairwise multiple comparison procedures using Dunn′s Method. Error bars in (c) are for the standard deviation. Scale bar =10 µm. Abbreviations: MHCII: MyosinII heavy chain; MLCII: MyosinII Light chain. |

MyosinII activity (pNMII levels) is higher in aPKC deficient embryos and is required for elongation of ridges in wild-type as well as in apkc morphants. pNMII staining (a) in wild-type and apkc morphant embryos at 20, 24 and 30hpf and in has/apkc mutants at 36hpf. Box-whisker plot for colocalisation coefficients (b) of F-actin and pNMII by Pearson’s methods (PC) and Manders’ overlap coefficient of pNMII with F-actin (M1) and F-actin with pNMII (M2) at 36 hpf in wild-type and has/apkc mutant embryos. Wild-type and apkc morphants (apkc MO) treated with 10µM Blebbistatin for 1.5h, fixed at 21hpf (c) and at 30hpf (d) followed by phalloidin staining to visualise F-actin. Probability values “P” are for the student’s t-test. Asterisk in (b) indicate significant difference at p<0.001. Scale bars correspond to 10 µm. Abbreviation: pNMII- phospho Non muscle-MyosinII. |
Over-expression of MLCK-CA does not give rise to longer ridges in pen/lgl2 mutants. Confocal microscopy analysis of the peridermal cells in given genotypes in either uninjected (control) or MLCK-CA injected embryos stained with phalloidin (a). Graphical representation of the distribution of ridge lengths and corresponding medians in various genotypes using bean plot (b). A bar graph showing percentage frequency distribution of ridges in short (0-5 µm), intermediate (5-20 µm), long (20-100 µm) and very long (>100 µm) categories (c). Representation of cell wise means and variances of ridge lengths in various genotypes using box-whisker plot (d). In (b) and (d) the distributions sharing the same alphabet do not differ significantly (Dunn’s multiple comparisons test, p-value < 0.05). Error bars in (c) are for the standard deviation. Scale bar in (a) is equivalent to 10 µm. |
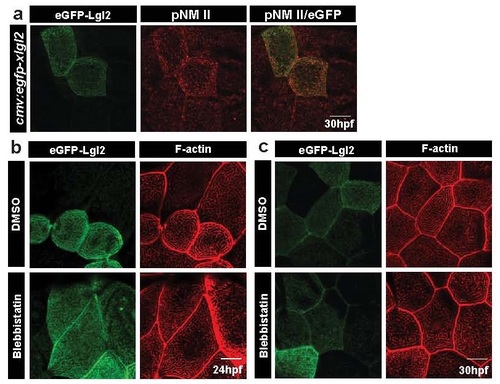
Lgl over-expression results in increased pNMII levels; MyosinII activity is essential for the manifestation of long ridge phenotype in cells over-expressing Lgl. Confocal images of wild-type embryos injected with cmv:egfp-xlgl2 and stained for GFP and pNMII at 30 hpf (a). eGFP-xLgl2 clones (b,c) treated with 10µM Blebbistatin for 1.5h, fixed at (b) 24hpf and (c) 30hpf and stained using phalloidin to visualise F-actin. Scale bar corresponds to 10 µm. |

F-actin polymerisation is required during ridge elongation phases in various genetic backgrounds. Peridermal cells in apkc morphant at 20 and 24hpf; MLCK-CA injected and wild-type embryos at 29hpf (a), eGFP-xLgl2 clones at 30hpf and wild-type larvae at 5dpf (b), treated with 2µM Latrunculin A for 30 minutes, fixed and stained using phalloidin to visualise F- actin. Scale bar corresponds to 10 µm. |

Assessment of the specificity of lgl1 morpholinos used in this study. Confocal images of microridge F-actin stained by phalloidin in un-injected embryos and embryos injected with standard control morpholino (Std control MO), lgl1ATG morpholino (lgl1ATG-MO) and lgl1UTR morpholino (lgl1UTR-MO) at 48hpf (a). Analysis of ridge lengths by F-actin staining in peridermal clones expressing eGFP-mLgl1 in embryos co-injected with the mentioned morpholino (or no morpholino) and a vector driving expression of egfp-mlgl1 under CMV promoter (b). Quantification of ridge lengths in the clones and visualisation of the length distributions and the respective medians in various genetic conditions by bean plot (c). The percentage frequency distribution of ridges in short (0-5 µm), intermediate (5-20 µm), long (20-100 µm) and very long (>100 µm) categories for the given genetic conditions (d). Estimation of cell wise means and variances of ridge lengths for each genetic condition and their representation by box-whisker plot (e). In (c) and (e), the horizontal black lines and associated probability values (P) represent the comparison by Dunn’s multiple comparisons. P<0.05 is considered statistically significant. In (d) Standard deviation is shown by error bars. Scale bars in (a,b) are equivalent to 10µm. The asterisks in (b) depict the cells that do not express eGFP-mLgl1. Abbreviation: Std: standard; MO: morphant/morpholino, mLgl1: mouse Lgl1 . |