
- Title
-
Mutations in SLC39A14 disrupt manganese homeostasis and cause childhood-onset parkinsonism-dystonia
- Authors
- Tuschl, K., Meyer, E., Valdivia, L.E., Zhao, N., Dadswell, C., Abdul-Sada, A., Hung, C.Y., Simpson, M.A., Chong, W.K., Jacques, T.S., Woltjer, R.L., Eaton, S., Gregory, A., Sanford, L., Kara, E., Houlden, H., Cuno, S.M., Prokisch, H., Valletta, L., Tiranti, V., Younis, R., Maher, E.R., Spencer, J., Straatman-Iwanowska, A., Gissen, P., Selim, L.A., Pintos-Morell, G., Coroleu-Lletget, W., Mohammad, S.S., Yoganathan, S., Dale, R.C., Thomas, M., Rihel, J., Bodamer, O.A., Enns, C.A., Hayflick, S.J., Clayton, P.T., Mills, P.B., Kurian, M.A., Wilson, S.W.
- Source
- Full text @ Nat. Commun.

SLC39A14 isoforms 1 and 2 show differences in tissue expression, Mn uptake and transcriptional regulation. (a) Immunostaining for SLC39A14 (all isoforms) in healthy control liver shows cell membrane expression (yellow arrow) and punctate cytoplasmic staining (black arrow); scale bar, 50µm; Abcam anti-SLC39A14 antibody (ab106568, 1:100); and in globus pallidus (GP) from a healthy control shows positively stained large neurons (black arrow); scale bar, 100 µm; Novus anti-SLC39A14 antibody (NBP1-81551, 1:1,000). (b,c) Confocal images demonstrating the subcellular localization of fluorescently tagged human SLC39A14 isoform 1 (b) and isoform 2 (c) expressed in zebrafish embryos. Immunostaining for EGFP and mCherry at 6 hpf shows that both isoforms are expressed at the cell membrane (co-localization with membrane mCherry) and in the cytoplasm. 4′,6-diamidino-2-phenylindole (DAPI) was used as a nuclear stain. Scale bar, 50µm. (d) RT-PCR of adult and fetal human tissues showing differences in mRNA expression between isoform 1 (ubiquitous expression in the tissues examined) and isoform 2 (* absent expression in brain, heart, skeletal muscle and skin). Amplicons for isoform 1 and 2 span 139 bp and 109 bp, respectively. Hypoxanthine-guanine phosphoribosyltransferase (HPRT) was used as a housekeeping gene. L, 100 bp ladder (Promega). (e) Graph showing Mn uptake in HEK-293 cells transiently transfected with wild-type SLC39A14 isoform 1 and 2, and empty pCS2+ vector following 15 and 30 min of MnCl2 (1 µM) exposure. Both isoforms facilitate Mn uptake. Cells transfected with isoform 2 have significantly higher Mn levels (P=0.009). Data are presented as means±s.d. from two independent experiments. Statistical analysis was performed using one-way ANOVA (P=0.0002 (15 min), P=0.0002 (30 min)) and Tukey’s multiple comparison test (***P<0.001). (f) Graph showing slc39a14 transcript levels assessed by qRT-PCR in 5 dpf zebrafish larvae after exposure to 500 µM MnCl2 for 24 h. Overall transcript levels are increased (P=0.035). Transcript levels of isoform 1 are unchanged (P=0.41) while those of isoform 2 show a 4.6-fold increase (P=0.005). Data are presented as means±s.d. from three independent experiments. Statistical analysis was performed using Student’s two-tailed t-test on individual ΔCt values (*P<0.05, **P<0.01). ANOVA, analysis of variance. |

Zebrafish slc39a14 is expressed during early zebrafish development and significantly reduced in slc39a14U801 mutants. (a) RT-PCR showing slc39a14 expression between 3 and 120 hpf in zebrafish. L, 100 bp ladder (Promega). (b) Whole-mount in situ hybridization using a DIG-labelled antisense RNA probe showing slc39a14 expression in the proximal convoluted (black arrows) and straight (red arrows) pronephric tubules in zebrafish larvae at 4 dpf. Top, lateral view; bottom, dorsal view. Scale bar, 200 µm. (c) DNA sequence of the region within exon 5 of slc39a14 targeted by a CRISPR guide RNA is highlighted in yellow and the 2-bp deletion introduced in the slc39a14U801 mutant indicated by dashes. Pam sequence underlined. (d) qRT-PCR demonstrates a 2.2-fold reduction in slc39a14 expression in homozygous slc39a14U801 mutants (*P=0.0117). Primers were designed to detect all slc39a14 transcripts (Supplementary Table 4). Ef1α was used as a reference gene. Data are presented as means±s.d. from three independent experiments. Statistical analysis was performed using Student’s two-tailed t-test on individual ΔCt values (*P<00.5). |
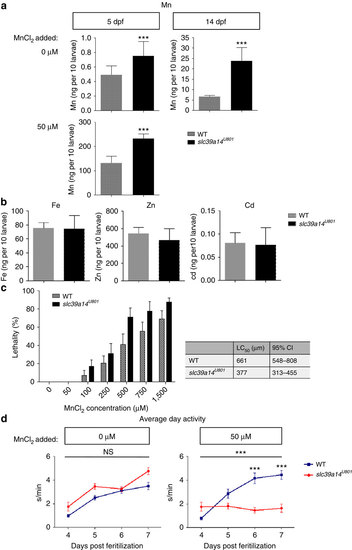
Loss of slc39a14 function in zebrafish leads to increased Mn accumulation and sensitivity as well as impaired locomotor behaviour. (a) Mn levels assessed in homozygous slc39a14U801 and wild-type (WT) larvae show that mutant larvae have significantly raised Mn levels at 5 dpf (P=0.001) and 14 dpf (P=0.0002), and Mn accumulation on MnCl2 exposure (50μM from 2 dpf) is significantly higher in mutant compared with WT larvae (P=0.000) at 5 dpf. Measurements were taken from pools of 10 larvae. Data are presented as means±s.d. from a minimum of five independent experiments. Statistical analysis was performed using Student’s two-tailed t-test (***P<0.001). (b) Graph showing Fe, Zn and Cd levels in 14 dpf mutant and WT larvae. Levels of all three metals are not significantly different between the two groups (P=0.906 [Fe], P=0.257 [Zn], P=0.834 [Cd]). Measurements were taken from pools of 10 larvae. Data are presented as means±s.d. from five independent experiments. Statistical analysis was performed using Student’s two-tailed t-test (NS, not significant). (c) Graph presenting the lethality in homozygous slc39a14U801 and WT larvae at 5 dpf on MnCl2 exposure between 2 and 5 dpf. Median lethal concentration (LC50) of MnCl2 determined by Probit regression analysis was 661μM for WT (95% confidence interval (CI) 548-808 μM) and 377 μM (95% CI 313-455 μM) for mutant fish. Data are presented as means±s.e.m. from nine independent experiments. (d) Locomotor behaviour studies of homozygous slc39a14U801 and WT larvae show that in unexposed conditions there is no significant difference in locomotor activity; and on MnCl2 exposure, locomotor activity is markedly reduced in mutant larvae compared with WT. The locomotor behaviour was tracked during 4 and 7 dpf using automated analysis software. s/min, movement in seconds per minute. Data are presented as means±s.e.m. 12 larvae were analysed per condition. Statistical analysis was performed using two way ANOVA (i, P=0.18; ii, P=0.000) (***P<0.001; NS, not significant). ANOVA, analysis of variance. PHENOTYPE:
|

Mn accumulates in the brain of slc39a14U801 mutants and can be lowered by Na2CaEDTA. Tissue Mn levels of wild-type (WT) and homozygous slc39a14U801 zebrafish at 1 year of age show that mutant brain tissue accumulates significantly higher amounts of Mn (P=0.0012) while no differences are evident in the Mn content of abdominal viscera (P=0.116). Measurements were taken from pools of four brains/abdominal viscera. Data are presented as means±s.d. from two independent experiments. Statistical analysis was performed using Student’s two-tailed t-test (**P<0.01; NS, not significant). (b) Graph showing the effect of Na2CaEDTA injections on Mn levels in homozygous slc39a14U801 larvae. Mutant larvae exposed to 50 μM MnCl2 from 2 to 5 dpf were injected into the heart with 5 or 50 ng of Na2CaEDTA at 2, 3 and 4 dpf, resulting in a reduction of Mn levels to that of wild-type larvae (P=0.000 (WT untreated versus mutant untreated), P=0.001 (mutant untreated versus 5 ng), P=0.001 (mutant untreated versus 50 ng)). Measurements were taken from pools of 10 larvae. Data are presented as means±s.d. from a minimum of three independent experiments. Statistical analysis was performed using one-way ANOVA (P=0.000) and Tukey’s multiple comparison test (**P<0.01, ***P<0.001). ANOVA, analysis of variance. |

Time course of slc39a14 expression during embryonic and early larval development in zebrafish. Whole mount in situ hybridisation using a DIG-labelled anti-sense RNA probe shows prominent expression of slc39a14 in the proximal convoluted and straight pronephric tubules (arrows) from 2 dpf. Scale bar 200 µm. |