
- Title
-
miR-219 regulates neural progenitors by dampening apical Par protein-dependent Hedgehog signaling
- Authors
- Hudish, L.I., Galati, D.F., Ravanelli, A.M., Pearson, C.G., Huang, P., Appel, B.
- Source
- Full text @ Development

Reduction of miR-219 causes persistent Hh signaling. (A-L) Representative transverse sections through trunk spinal cord with dorsal up. Dashed circles outline spinal cords. In situ RNA hybridization to detect shha in wild-type embryos (A-C) and miR-219 MO-injected embryos (D-F) at 1, 2 and 3dpf (G-I). In situ RNA hybridization to detect ptch2 transcripts in wild-type embryos reveals expression throughout the entire dorsoventral axis of the spinal cord at 1 and 2dpf. By 3dpf, expression is confined to an area bordering the ventrally located central canal. (J-L) miR-219 MO-injected embryos processed to detect ptch2 RNA. ptch2 expression appears to persist in dorsal spinal cord of the miR-219-deficient embryo (L). (M) Graph showing that 3dpf miR-219 MO-injected larvae express ptch2 and gli1 RNA at higher levels than stage-matched controls. Data represent the mean±s.e.m. (n=3 biological replicate experiments, consisting of 15-20 larvae, each). Significance calculated using an unpaired t-test. (N-Q) Representative maximum projection images of confocal images stacks of ptch2:Kaede expression in control and miR-219 MO-injected embryos at 1dpf (N,O) and 3dpf (P,Q). (R-U) Heat maps showing the average normalized fluorescence profile of spinal cord (sc, brackets) ptch2:Kaede at 1dpf (n=22 control embryos and 20 miR-219 MO-injected embryos) (R,S) and 3dpf (n=22 control and 18 miR-219 MO-injected) (T,U), straightened and aligned along the dorsoventral axis, with dorsal to the top. All heat maps display in the range of 0-150 arbitrary fluorescence intensity units (blue to red). (V,W) Average normalized fluorescence profile of ptch2:Kaede fluorescence generated by creating line scans along the dorsoventral axis. The solid colored lines (red and blue) represent the average normalized fluorescence profile at each pixel along the dorsoventral axis of 1dpf (R) and 3dpf (W) spinal cords, whereas the grey lines represent the s.e.m. at each pixel. |

miR-219-mediated neural progenitor maintenance requires Hh signaling. (A-P) Representative transverse sections through trunk spinal cords of 3dpf embryos with dorsal up. Dashed circles outline spinal cords and brackets indicate central canals/primitive lumens highlighted by ZO-1 and Prkci localization. ZO-1 (A-D) and Prkci (E-H) localization at apical membranes detected by immunohistochemistry. In wild-type (A,E) and cyclopamine-treated wild-type (B,F) embryos, ZO-1 and Prkci are localized to apical membranes surrounding a small, ventrally positioned central canal. miR-219 MO-injected embryos have primitive lumens, decorated by ZO-1 and Prkci, that extend across the dorsoventral length of the spinal cord (C,G). Cyclopamine treatment suppresses the lumenal and apical protein localization phenotype of miR-219 MO-injected embryos (D,H). (I-L) Spinal cord progenitors revealed by Sox2 immunohistochemistry. Cyclopamine treatment suppresses the excess progenitor phenotype of miR-219 MO-injected embryos. (M-P) Dividing spinal cord cells revealed by PH3 immunohistochemistry. Cyclopamine treatment suppresses the excess dividing cell phenotype of miR-219 MO-injected embryos. (R) Graph showing quantification of the ZO-1 phenotype. Embryos classified as normal had ZO-1 expression around the ventrally located central canal. Embryos were classified as severe when ZO-1 localization spanned the entire dorsoventral axis and mild when it spanned an intermediate length. Data represent the mean±s.e.m. (n=15 larvae for each group). P values were calculated by comparing the numbers of larvae with severe and mild phenotypes in miR-219 MO alone and the miR-219 MO+cyclopamine experiments. P<0.0001 for the severe group and P=0.0062 for the mild group, unpaired t-test. (S) Graph showing quantification of the Prkci phenotype. Embryos were scored as in R. Data represent the mean±s.e.m. (n=15 larvae for each group). P<0.001 for the severe group and P=0.0033 for the mild group, unpaired t-test. (T) Graph showing the number of Sox2+ progenitors. Data represent the mean±s.e.m. (n=15 embryos per group). Significance calculated using an unpaired t-test. (U) Graph showing the number of PH3+ cells in wild-type control, wild-type+cyclopamine, miR-219 MO and miR-219 MO+cyclopamine larvae. Data represent the mean±s.e.m. (n=15 sections obtained from 5 larvae per group, with three replicates). Significance calculated using an unpaired t-test. |

Shh overexpression phenocopies loss of miR-219 function. (A) Graph showing that 3dpf heatshocked Tg(hsp70l:Shha-EGFP) (Shh HS) larvae express ptch2 at higher levels than controls and that cyclopamine treatment almost abolishes ptch2 mRNA levels. Data represent the mean±s.e.m. (n=2 biological replicate experiments, consisting of 15-20 larvae, each). Significance calculated using an unpaired t-test. (B,C) Heat maps showing the average normalized fluorescence profile of control (n=21) and Shh HS (n=21) spinal cord (sc, brackets) ptch2:Kaede expression at 3dpf, straightened and aligned along the dorsoventral axis. Dorsal is to the top. All heat maps display in the range of 0-150 arbitrary fluorescence units (blue to red). Insets show representative maximum projection images of confocal stacks obtained from single larvae. (D) Average normalized fluorescence profile of ptch2:Kaede generated by creating line scans along the dorsoventral axis. The solid colored lines (red and blue) represent the average normalized fluorescence profile at each pixel along the dorsoventral axis whereas the grey lines represent the s.e.m. at each pixel. Control (E,H,K,M) and heat-shocked Tg(hsp701:Shha:EGFP) (Shh HS) (F,I,L,N) embryos shown in transverse section with dorsal up. Dashed circles outline the spinal cord and brackets indicate the central canal/primitive lumen. (E,F) Immunohistochemistry to detect neural progenitors, marked by Sox2 expression. (G) Graph showing the number of Sox2+ cells in control and Shh-overexpressing embryos. Data represent the mean±s.e.m. (n=15 embryos per group from 3 independent experiments). Significance calculated using an unpaired t-test. (H,I) EdU incorporation to detect dividing neural progenitors. (J) Graph showing the number of EdU+ cells in the spinal cord at 3dpf. Data represent the mean±s.e.m. (n=20 embryos per group). Significance calculated using an unpaired t-test. (K-N) 3dpf Shh-overexpressing embryos maintain a primitive lumen marked by apically localized ZO-1 and Prkci. |

Apical Par proteins mediate the effects of miR-219 function on Hh signaling. (A-C) In situ RNA hybridization to detect ptch2 expression in 3dpf control, pard3 TP MO-injected and prkci TP MO-injected embryos. Dashed circles outline the spinal cord and brackets mark ptch2 expression domain. (D) Graph showing relative ptch2 and gli1 RNA levels measured by qPCR. Data represent the mean±s.e.m. (n=3-5 biological replicates, consisting of 15-20 pooled embryos). Significance calculated using an unpaired t-test. (E-I) In situ RNA hybridization reveals reduced ptch2 levels in 2dpf and 3dpf prkci mutant embryos and prkci mutant embryos injected with miR-219 MO. (J) Graph showing relative ptch2 and gli1 expression levels measured by qPCR. Data represent the mean±s.e.m. (n=3 biological replicates consisting of 15-20 pooled embryos, each). Significance calculated using an unpaired t-test. |

Apical Par proteins regulate primary ciliogenesis. (A-C) Lateral images of living 3dpf Tg(µact::Arl13b-GFP) embryos, focused on the trunk spinal cord. Scale bar: 20µm. Brackets mark the spinal cord (sc) and outlined boxes show digital enlargements of primary cilia. The long motile cilia in ventral spinal cord were not used for these analyses. Scale bar: 1µm. (D) Graph showing cilia length. Data represent the mean±s.e.m. (n=30 embryos from 3 independent experiments for each group and 10-30 cilia measured in each embryo). Significance calculated using an unpaired t-test. (E) Graph showing cilia length in 3dpf control, pard3 TP MO-injected and prkci TP MO-injected embryos. Data represent the mean±s.e.m. (n=30 embryos from 3 independent experiments for each group, and 10-30 cilia measured in each embryo). Significance calculated using an unpaired t-test. (F-M) Confocal images captured from time-lapse movies of dividing cells in the trunk spinal cord of a control embryo, beginning at 24hpf. Time elapsed from the start of the movie is indicated on each panel. Cilia are labeled by Arl13b-EGFP and cell membranes are marked by membrane-tethered mCherry. Scale bar: 10µm. Outlined boxes show digital enlargements of cilia. Scale bar: 1µm. (N) Graph showing average cilia length (µm) over 120min and outlined boxes show digital enlargements of cilia. The 0min time point corresponds to the 88min time point in J. Slope shows the rate of cilia growth is greater in miR-219 MO-injected embryos than in controls. Data represent the mean±s.e.m. (n=7 cells from 7 embryos for both conditions). Significance calculated using unpaired t-test. **P=0.01959, *P=0.0527. |
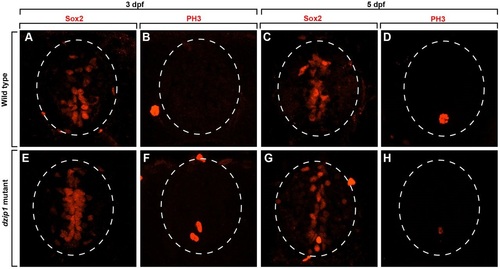
Cilia-deficient mutant embryos have normal numbers of neural progenitors. (A-H) All images show representative transverse sections through trunk spinal cords of 3 and 5dpf embryos with dorsal up. Dashed circles outline spinal cords. Representative images of control embryos at 3dpf (A,B) and 5dpf (C,D). Immunohistochemistry to detect neural progenitors marked by Sox2 expression (A,C) and phosphohistone H3 (PH3) to detect cells undergoing mitosis (B,D). dzip mutant embryos were also labeled with Sox2 at 3dpf (E) and 5dpf (G) and PH3 at 3dpf (F) and 5dpf (H). |