
- Title
-
The circadian clock regulates autophagy directly through the nuclear hormone receptor Nr1d1/Rev-erbα and indirectly via Cebpb/(C/ebpβ) in zebrafish
- Authors
- Huang, G., Zhang, F., Ye, Q., Wang, H.
- Source
- Full text @ Autophagy

Autophagy rhythms in zebrafish. (A) Transmission electron micrograph of the zebrafish liver sections at ZT 0, ZT 6, ZT 12 and ZT 18. The scale bar in the bottom left corner of ZT 0 panel represents one micron. High magnification in the right low corners highlights a cytosolic region. Note the presence of double-membrane autophagosomes and autolysosomes (red arrowhead). (B) Quantification of autophagosome and autolysosome abundance in (A). Data represent mean ± s.e. **, P ≤ 0.01. The Student t test was conducted. (C) RT-PCR analysis of expression of map1lc3b, bnip3, atp6v1d, becn1, ulk1a and ulk1b in zebrafish larvae from 72 hpf to 96 hpf. Zebrafish were maintained at 14 h light and 10 h dark condition. Approximately 50 zebrafish larvae were pooled for each time point. (D) RT-PCR analysis of expression of map1lc3b, bnip3, atp6v1d, becn1, ulk1a and ulk1b in zebrafish livers. Livers from 5 adult zebrafish were pooled for each time point. The mRNA expression levels were analyzed by the JTK-CYCLE method. ADJ.P for adjusted minimal P values (*, P ≤ 0 .05; ***, P ≤ 0 .001), AMP for amplitude. One-way ANOVA was conducted (***, P ≤ 0 .001). Data represent mean ± s.d. of the 3 independent experiments. EXPRESSION / LABELING:
|

ZFIN is incorporating published figure images and captions as part of an ongoing project. Figures from some publications have not yet been curated, or are not available for display because of copyright restrictions. PHENOTYPE:
|

Disrupted autophagy activities and altered expression of autophagy genes in nr1d1 mutant zebrafish. (A) Zebrafish larval autolysosomes were estimated by expression of mCherry-Map1lc3b at 56 hpf. The scale bar in the lower left of the wild-type panel represents 100 microns. The right upper panels show high magnification highlighting a hindbrain region in both wild-type and nr1d1 mutant larva labeled with mCherry-Map1lc3b. (B) Transmission electron micrograph of wild-type and nr1d1 mutant liver sections at ZT 0. The scale bar in the lower left of the wild-type panel represents one micron. (C) Quantification of autolysosomes in (A), calculated manually. (D) Quantification of autophagosome abundance in (B) with software ImageJ. The figure represents one of the 3 independent sets of samples. Data represent mean ± s.d.(**, Pd0 .01). The Student t test was conducted, (**, P ≤ 0 .01). (E) RT-PCR analysis of autophagy genes in nr1d1 (7bp or +124,-2bp) mutant zebrafish at different time points under DD condition. Zebrafish larvae were raised under light/dark (14 h/10 h) condition for the first 3 dpf, and then placed under constant darkness condition. Approximately 50 zebrafish larvae were pooled for each time point. The mRNA expression levels were analyzed by the JTK-CYCLE method. ADJ.P for adjusted minimal p-values (*, P ≤ 0 .05; ***, P ≤ 0 .001), AMP for amplitude. Two-way ANOVA with the Tukey post hoc test was conducted (*, P ≤ 0 .05; **, P ≤ 0 .01). |
|
ZFIN is incorporating published figure images and captions as part of an ongoing project. Figures from some publications have not yet been curated, or are not available for display because of copyright restrictions. |
|
ZFIN is incorporating published figure images and captions as part of an ongoing project. Figures from some publications have not yet been curated, or are not available for display because of copyright restrictions. |
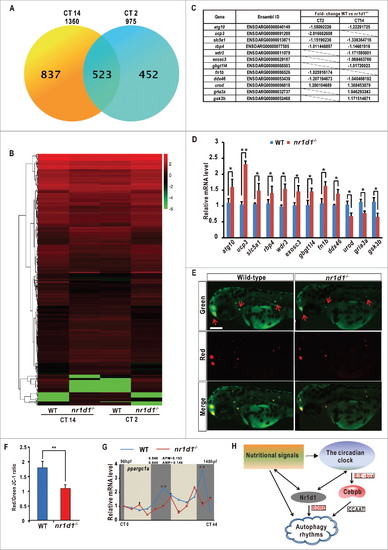
Transcriptome analysis and a model for circadian regulation of autophagy. (A) Numbers of differentially expressed genes (DEGs) in nr1d1 mutant fish at CT2 and CT12, revealed by transcriptome analysis. (B) Histogram of 523 DEGs in nr1d1 mutant fish shared between CT12 and CT2. Red colors represent upregulation, green colors downregulation. (C) List of genes with significant fold-changes, revealed by transcriptome analysis. The fold-changes were calculated by values of WT vs. nr1d1/rev-erbα. Genes with positive values were downregulated in the nr1d1 mutant, and those with negative values upregulated. (D) Upregulated genes atg10, ucp3, slc5a1, rbp4, wdr3, exosc3, gbgt1l4, fn1b and ddx46 and downregulated genes urod, gria3a and gsk3b, revealed by transcriptome analysis, are reconfirmed by independent qRT-PCR analysis. Three independent experiments were performed. Data represent mean ± s.d. (E) JC-1 staining assays. Mitochondria with low membrane potential are in green and mitochondria with high membrane potential in red. (F) Relative Red/Green ratio was quantified by ImageJ. Data represent mean±s.d. of the 3 independent experiments. **, P ≤ 0 .01. The Student t test was applied. (G) qRT-PCR analysis of ppargc1a in nr1d1 mutants under DD condition. The mRNA expression pattern was analysis by JTK-CYCLE method. ADJ.P for adjusted minimal P-values (*, P ≤ 0 .05), AMP for amplitude. Two-way ANOVA with the Tukey post hoc test was conducted (***, P ≤ 0 .001). (H) A model for circadian regulation of autophagy in zebrafish. Transcription factor cebpb is regulated by the Clock-Arntl/Bmal heterodimer and induces autophagy rhythms in zebrafish and mice, while Nr1d1 directly controls autophagy genes through RORE. Further, nutritional signals can affect both autophagy and circadian rhythms in zebrafish. |