
- Title
-
Minimal contribution of ERK1/2-MAPK signalling towards the maintenance of oncogenic GNAQQ209P-driven uveal melanomas in zebrafish
- Authors
- Mouti, M.A., Dee, C., Coupland, S.E., Hurlstone, A.F.
- Source
- Full text @ Oncotarget
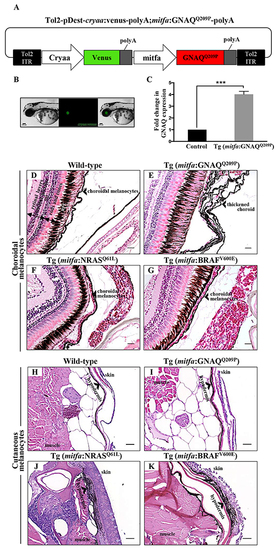
Only oncogenic GNAQQ209P is sufficient to induce choroidal melanocyte hyperplasia. A. Schematic representation of elements in the Tol2-based transposon vector driving the expression of oncogenic GNAQQ209P under the control of zebrafish mitfa promoter in the melanocyte lineage and Venus fluorescent reporter under the control of cryaa promoter in the eye lens. Abbreviations: ITR, inverted terminal repeat. B. Example of a 5 dpf transgenic zebrafish embryo with a fluorescent eye lens. Scale bar, 100 μm. C. RT-qPCR data showing a 4.1 fold increase in GNAQ expression in the melanocytes of 2-month-old F1 Tg (mitfa:GNAQQ209P) zebrafish, as compared to non-injected controls. Data represents mean ± SEM of triplicates of three independent experiments. *** P <0.05 using two-tailed, unpaired t test. D, E, F, G. H&E staining of transverse sections of formalin-fixed and paraffin-embedded eye specimens of control wild-type, Tg (mitfa:GNAQQ209P), Tg (mitfa:NRASQ61L), and Tg (mitfa:BRAFV600E) zebrafish, respectively. Choroidal hyperplasia observed in the thickened choroid (E; black arrowhead) was only observed in transgenic animals expressing oncogenic GNAQQ209P. In contrast, as compared to control wild-type H. and Tg (mitfa:GNAQQ209P) I. hyperplasia of cutaneous melanocytes (black arrowhead) was only detected in transverse sections of the torso region of Tg (mitfa:NRASQ61L) J. and Tg (mitfa:BRAFV600E) K. zebrafish. Abbreviations: RPE, retinal pigmented epithelium. Scale bars, 20 μm. PHENOTYPE:
|
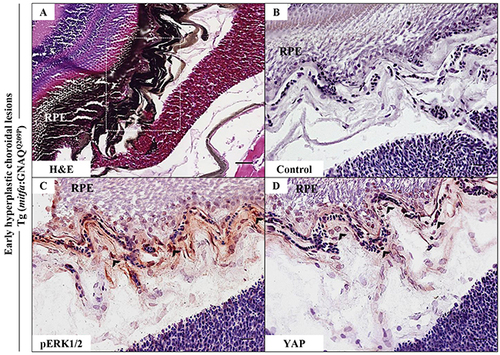
Oncogenic GNAQQ209P-mediated activation of ERK and YAP signalling in choroidal melanocytes at the junction between RPE and choroid. A-D. Transverse sections of formalin-fixed and paraffin-embedded eye tissues of F1 generation, 5-month-old Tg (mitfa:GNAQQ209P) zebrafish. (A) H&E staining demonstrating choroidal hyperplasia (black arrowheads). White dashed box indicates the region of the choroid magnified in B-D. (B-D) Transverse sections of formalin-fixed and paraffin-embedded eye tissues were stained by IHC, visualized by ImmPact NovaRed peroxidase (HRP) substrate then counterstained with hematoxylin (blue). (B) Negative control: section incubated with 1x PBS instead of primary antibody. (C) Immunoreactivity to pERK1/2 (read-out of ERK activation; black arrowheads) in melanocytes at the interface between the RPE and choroid. (D) YAP-positive nuclei (read-out of YAP activation; black arrowheads) in the same cells. Scale bars, 20 μm. PHENOTYPE:
|
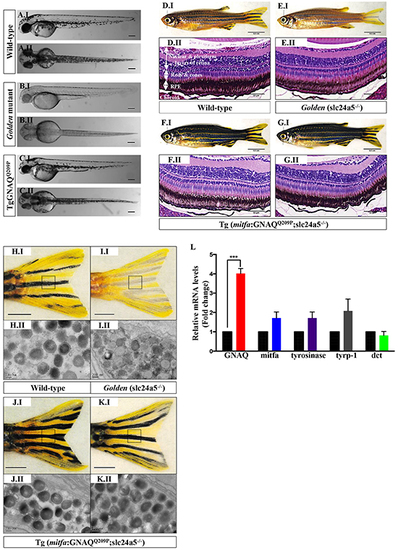
GNAQQ209P rescues the hypopigmentation phenotype of golden (slc24a5-/-) zebrafish. A.I, B.I, C.I. Lateral views of wild-type, golden, and Tg (mitfa:GNAQQ209P;slc24a5-/-) 5 dpf zebrafish embryos, respectively. A.II, B.II, C.II. Top views of wild-type, golden, and Tg (mitfa:GNAQQ209P;slc24a5-/-) 5 dpf zebrafish embryos, respectively. Scale bars, 100 μm. D.I, E.I, F.I, G.I. Lateral views of 2-month-old adult zebrafish. (D.I) Wild-type illustrating normal melanin pigmentation in skin melanocytes. (E.I) Light-skinned golden mutant (slc24a5-/-) with stripes comprising less melanin-rich melanocytes. (F.I, G.I) Two examples of Tg (mitfa:GNAQQ209P;slc24a5-/-) zebrafish from independent founders, acquiring darker stripes as compared to wild-type (D.I) and golden mutants (E.I), but still conserving the normal striped pigment pattern. Scale bars, 0.5 cm. D.II, E.II, F.II, G.II. H&E staining of transverse sections of formalin-fixed and paraffin-embedded eye specimens of 2-month-old adult zebrafish. (D.II) Normally pigmented RPE located between the photoreceptors layer of the retina (rods & cones) and the choroid in a wild-type zebrafish. (E.II) Lightly pigmented RPE in a golden mutant. (F.II, G.II) Rescuing of hypopigmented RPE in both GNAQQ209P-expressing golden mutants, with no pathological findings yet observed in the choroidal melanocyte layer. Scale bars, 50 μm. H.I, I.I, J.I, K.I. Tail fins of wild-type, golden, and two Tg (mitfa:GNAQQ209P;slc24a5-/-) zebrafish, respectively. These were dissected, fixed, and sectioned for TEM analysis. Black dashed boxes indicate representative regions of the tail fins examined by TEM. Scale bars, 0.5 cm. H.II, I.II, J.II, K.II. Transmission electron micrographs illustrating the structure of melanosomes in the melanocytes of dissected tail fins. Melanosomes in golden mutants (I.II) are less densely pigmented as compared to those of wild-type (H.II) and transgenic zebrafish (J.II, K.II). Scale bars, 200 nm. L. Relative to zebrafish EF1alpha (EF1α) expression and as compared to non-injected golden controls, qRT-PCR data show significant increase in mRNA expression levels of GNAQ in Tg (mitfa:GNAQQ209P;slc24a5-/-) zebrafish. In contrast, no significant alterations were observed in the expression of mitfa or downstream differentiation genes including tyrosinase, tyrp-1, and dct. Results represent mean ± SEM of triplicates of three independent experiments. ***P <0.05, using two-tailed, unpaired t test. Abbreviations: tyrp-1, tyrosinase-related protein 1; dct, dopachrome tautomerase. PHENOTYPE:
|
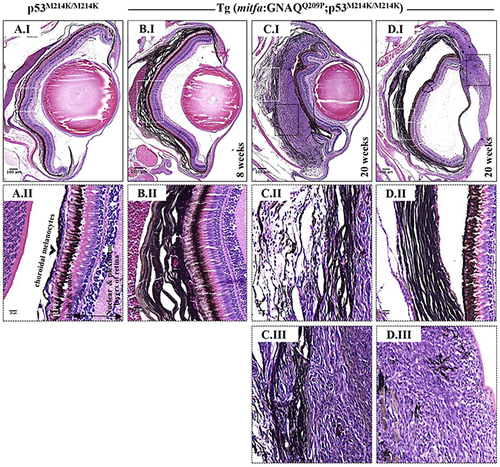
Co-operation of oncogenic GNAQQ209P and p53 loss-of-function results in UM development. Oncogenic GNAQQ209P Tol2 construct was injected into p53-deficient (p53M214K/M214K) zygotes, animals were sacrificed at 2 and 5 months or sooner if ocular protrusion was prominent, then fixed eye specimens were processed and paraffin-embedded for transverse sectioning at a thickness of 5 μm, followed by H&E staining. Representative images are shown. A.I. A non-injected p53-deficient (p53M214K/M214K) control zebrafish illustrating a single layer of choroidal melanocytes. B.I. Benign choroidal hyperplasia in an 8-week-old Tg (mitfa:GNAQQ209P;p53M214K/M214K) zebrafish. Note the diffuse thickening of the entire choroid caused by the proliferation of choroidal melanocytes. Nuclear and plexiform layers of the retina, photoreceptors layer, and RPE are structurally normal. Also, sclera is respected, with no evidence of infiltration or perforation. C.I. An example of malignancy, with non-pigmented hyperproliferative atypical cells developing within an area that shows evidence of choroidal hyperplasia in a 20-week-old Tg (mitfa:GNAQQ209P;p53M214K/M214K) zebrafish. D.I. A second example of a 20-week-old Tg (mitfa:GNAQQ209P;p53M214K/M214K) zebrafish developing an eye malignancy infiltrating the ciliary body, iris, and cornea, also with evidence of choroidal hyperproliferation. A.II, B.II, C.II, D.II. Magnifications of the regions within the white dashed boxes in A.I, B.I, C.I, D.I, respectively, illustrating the changes within the choroidal melanocyte layer (B.II, C.II, D.II), as compared to a structurally normal choroid in a non-injected control (A.II). (C.III, D.III) Magnifications of transformed uveal melanocytes depicted in the black dashed boxes in C.I and D.I, respectively. Abbreviations: RPE, retinal pigmented epithelium. Scale bar lengths, as indicated. PHENOTYPE:
|
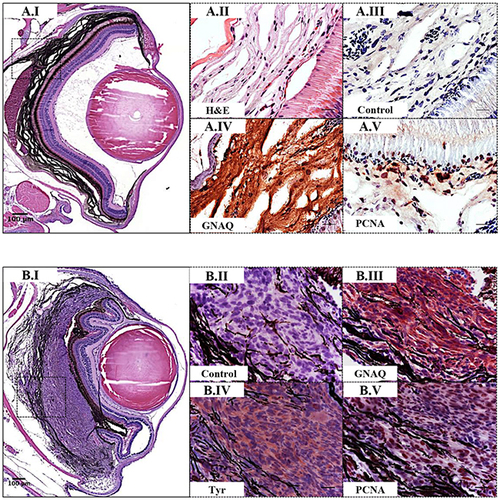
Validation of GNAQQ209P-driven choroidal hyperplasia and uveal tumours in Tg (mitfa:GNAQQ209P;p53M214K/M214K) zebrafish. Transverse sections of formalin-fixed and paraffin-embedded zebrafish eye tissues were stained by IHC, visualized by ImmPact NovaRed peroxidase (HRP) substrate then counterstained with hematoxylin (blue). Representative H&E and IHC images are shown for the pre-malignant A.I-A.V. and malignant B.I-B.V. stages. (A.I) H&E staining illustrating a 5x magnification of a benign choroidal hyperplasia in a 2-month-old Tg (mitfa:GNAQQ209P;p53M214K/M214K) zebrafish. (A.II-A.V) Magnifications of the region depicted in the black dashed box in A.I. (A.II) H&E staining of a melanin-bleached section, revealing multiple cellular layers of the thickened choroid. (A.III) Negative control section for IHC staining. (A.IV) GNAQ expression in thickened choroid. (A.V) Hyperplastic choroidal melanocytes are positive for PCNA (dark brown nuclei), especially at the junctional zone between RPE and choroid. (B.I) H&E staining illustrating a 5x magnification of a uveal tumour developing in a 5-month-old Tg (mitfa:GNAQQ209P;p53M214K/M214K) zebrafish. (B.II) Negative control section for IHC staining. (B.III) Malignant cells expressing GNAQ. (B.IV) Positive immunoreactivity to the melanocytic differentiation marker tyrosinase, indicating the melanocytic origin of malignant cells. (B.V) Numerous PCNA-positive nuclei (dark brown) in malignant melanocytes. Abbreviations: Tyr, tyrosinase; PCNA, proliferating cell nuclear antigen. Scale bars, 100 μm (A.I, B.I); 20 μm (A.II-A.V; B.II-B.V). PHENOTYPE:
|
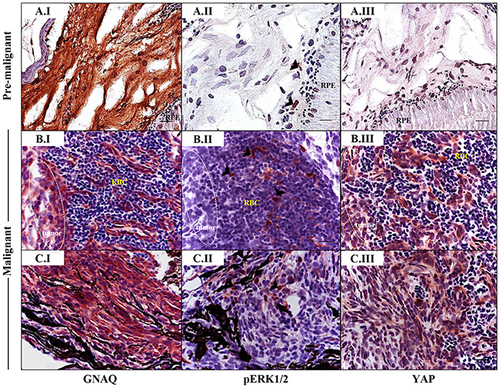
Sporadic ERK activation contrasted with ubiquitous nuclear YAP in malignancies in Tg (mitfa:GNAQQ209P;p53M214K/M214K) zebrafish. Sections of formalin-fixed and paraffin-embedded zebrafish eye specimens were stained for GNAQ, pERK1/2, and YAP by IHC, visualized by ImmPact NovaRed peroxidase (HRP) substrate then counterstained with hematoxylin (purple nuclei). A.I-A.III. Representative IHC images of benign hyperproliferative choroid. (A.I) Uniform expression of GNAQ in hyperplastic choroidal melanocytes. (A.II) Only a few cells (black arrowheads) are immunoreactive to pERK1/2. (A.III) Comparatively, more cells displayed nuclear YAP (brown nuclei), although again, this was more noticeable for cells residing at the interface. B.I-B.III; C.I-C.III. Representative IHC images of malignant choroidal melanocytes in two independent GNAQQ209P-driven uveal tumours. (B.I, C.I) Transformed melanocytes expressing GNAQ. (B.II, C.II) Malignant cells showing only sporadic immunoreactivity to pERK1/2 (cells showing positive immunoreactivity are indicated with black arrowheads). (B.III, C.III) Ubiquitous YAP nuclear localization (brown nuclei) in transformed uveal melanocytes. Images are representative of sections from three animals. Abbreviations: RPE, retinal pigmented epithelium; RBC, red blood cells. Scale bars, 20 μm. PHENOTYPE:
|
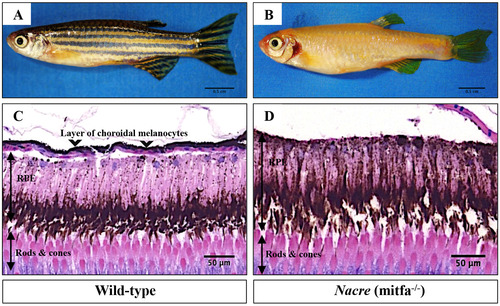
mitfa is required for the development of zebrafish choroidal melanocytes. (Top panel) Lateral views of adult wild-type A. and homozygous mitfa-/- (nacre; B. zebrafish. (Bottom panel) H&E staining of transverse sections of formalinfixed and paraffin-embedded eye specimens of adult wild-type C. and nacre D. zebrafish. Wild-type tissue section shows a single layer of choroidal melanocytes (black arrowheads). In contrast, choroidal melanocytes are absent in nacre mutants. Abbreviations: RPE, retinal pigmented epithelium. Scale bars, as indicated. |
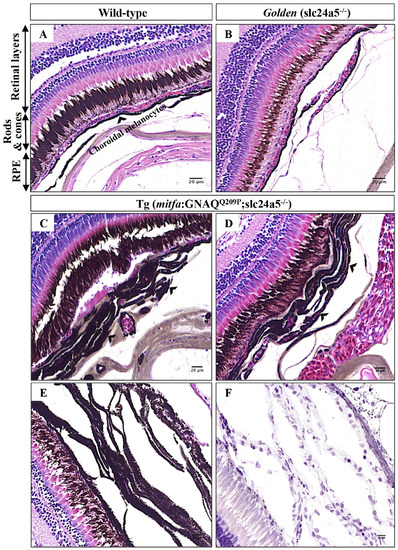
Choroidal hyperplasia is evident in pigmentation-rescued Tg (mitfa:GNAQQ209P;slc24a5-/-) zebrafish. A-D. H&E staining of transverse sections of formalin-fixed and paraffin-embedded eye tissues of a 5-month-old adult zebrafish. (A) Wild-type demonstrating different structures of the zebrafish retina as indicated. (B) Golden mutant: note the hypopigmented RPE and structurally normal choroid. (C, D) Tg (mitfa:GNAQQ209P;slc24a5-/-): note here benign hyperplastic choroidal lesions (black arrowheads) developing beneath pigmentation-rescued RPE. E. A representative example of H&E stained transverse section illustrating thickened and heavily pigmented choroidal melanocyte layer before melanin bleaching. F. Multiple cellular layers of thickened choroid, as revealed by multiple nuclei (blue; counterstained with hematoxylin) after melanin bleaching. Abbreviations: RPE, retinal pigmented epithelium. Scale bar lengths, as indicated. |
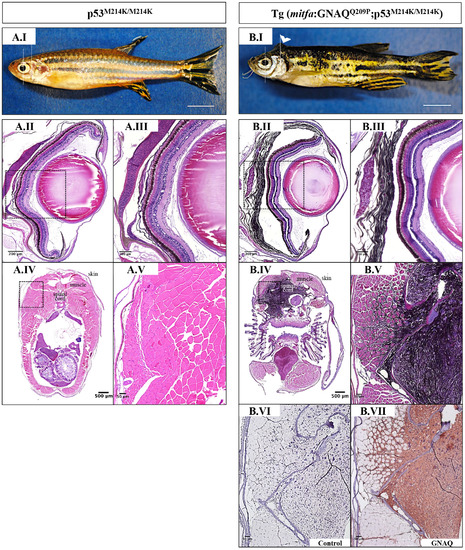
Oncogenic GNAQQ209P expression induces malignant CNS melanoma in p53-deficient zebrafish. A.I, B.I. Lateral views of 5-month-old zebrafish. (A.I) p53-deficient zebrafish (p53M214K/M214K). (B.I) Tg (mitfa:GNAQQ209P;p53M214K/ M214K) zebrafish developing masses protruding from the back of the head (white arrowhead). Scale bars, 0.5 cm. Representative images of H&E stained tissue sections through the torso of p53M214K/M214K animals A.IV, A.V. and age-matched Tg (mitfa:GNAQQ209P; p53M214K/M214K) B.IV, B.V. show highly infiltrative, pigmented malignancy appearing to emanate from the leptomeninges surrounding the hind brain of the latter. The same animals were sectioned through the eyes revealing normal development of the choroid in p53M214K/M214K mutants A.II, A.III., but benign hyperproliferation of choroidal melanocytes in Tg (mitfa:GNAQQ209P;p53M214K/M214K) B.II, B.III.. (A.III, A.V, B.III, B.V) Magnifications of the regions depicted in black dashed boxes in A.II, A.IV, B.II, B.IV, respectively. B.VI. Negative control section incubated with 1x PBS instead of primary antibody. B.VII. Area of pigmented melanocytic infiltration showing GNAQ expression upon IHC staining. Scale bar lengths, as indicated. |
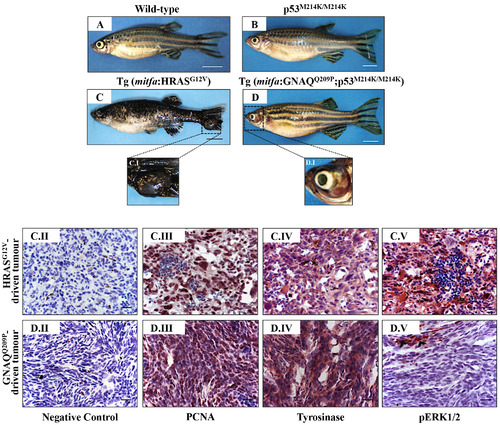
Oncogenic GNAQQ209P and HRASG12V show different potentials in sustaining ERK1/2-MAPK signalling in melanomas of uveal and cutaneous origins. Lateral views of wild-type A. p53M214K/M214K B. Tg (mitfa:HRASG12V) C. and Tg (mitfa:GNAQQ209P;p53M214K/M214K) D. adult zebrafish. Scale bars, 0.5 cm. C.I, D.I. Magnifications of the regions depicted in the black dashed boxes in C and D, respectively. C.II-C.V. Representative IHC images of HRASG12V-driven cutaneous tumours. (C.II) Negative control. (C.III) Numerous melanocytic tumour cells expressing the proliferation marker PCNA: nuclei are stained blue (hematoxylin) and PCNApositive cells acquire dark brown nuclei. (C.IV) Malignant cells expressing the melanocytic differentiation marker tyrosinase. (C.V) Strong immunoreactivity of transformed cutaneous melanocytes to pERK1/2, indicating the activation of ERK1/2-MAPK signalling. D.II-D.V. Representative IHC images of GNAQQ209P-driven uveal tumours. (D.II) Negative control. (D.III) Malignant cells expressing PCNA (dark brown nuclei).(D.IV) Positive immunoreactivity of transformed cells to tyrosinase, indicating the melanocytic origin of the developed ocular neoplasia. (D.V) Transformed uveal melanocytes are barely immunoreactive to pERK1/2, indicating low activity of ERK1/2-MAPK signalling. Abbreviations: PCNA, proliferating cell nuclear antigen. Scale bars, 20 μm. |