
- Title
-
Hydrogen peroxide (H2O2) controls axon pathfinding during zebrafish development
- Authors
- Gauron, C., Meda, F., Dupont, E., Albadri, S., Quenech'Du, N., Ipendey, E., Volovitch, M., Del Bene, F., Joliot, A., Rampon, C., Vriz, S.
- Source
- Full text @ Dev. Biol.
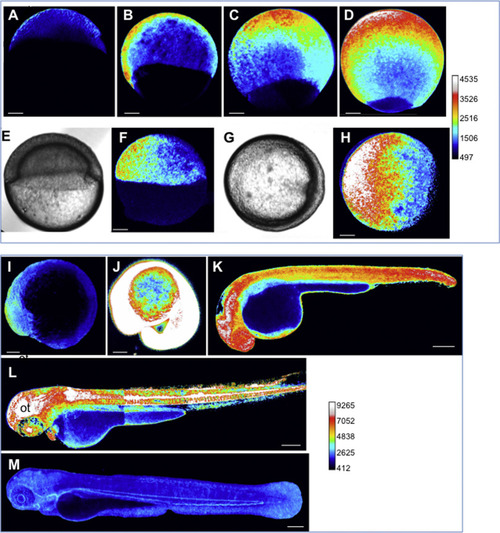
Dynamics of the H2O2 levels during development. HyPer imaging in developing zebrafish embryos. The H2O2 levels are inferred from the YFP500/YFP420 excitation ratio of HyPer. (A) Blastula, (B-H) gastrulation. (E-H) During gastrulation, H2O2 is detected at the opposite side of the shield (E-H). (E, G) Bright-field images corresponding to F and H, respectively. (I) Early somitogenesis, (J) 20 somites (K) 30 hpf, (L) 48 hpf, (M) 72 hpf. Representative images are shown as lateral views, except for those in G-H (animal view). Pseudo-colour calibration bars: HyPer ratio (YFP500/YFP420). The bar common for A-H and the bar common for I-M allow the H2O2 levels in each group to be compared. Scale bars, 100 µm (A-J) and 200 µm (K-M). ot: optic tectum. |

The H2O2 levels are regulated at the degradation step. (A-C) HyPer imaging during gastrulation. The embryos were incubated in 1 mM H2O2 and the HyPer signal was measured prior to incubation and 15 min after the addition of H2O2. Exogenous H2O2 enhanced the H2O2 signal in the tissues with high endogenous H2O2 levels (region x), but has a minimal, if any, effect on cells without H2O2 (region y). n=3; representative lateral views are shown. (D) Superoxide dismutase (SOD) activity (E) and Catalase (CAT) activity during development. Legends: 75% epi=gastrulation, 8 som=somitogenesis. The error bars represent the standard error of the mean (SEM) (*p<0.05; ***p<0.001). |

A reduction of the H2O2 levels impairs the RGC projections. (A, B) HyPer imaging at 2 dpf in the control (n=3), or Nox-i-treated larvae (n=3). (C) Number of pixels corresponding to the pseudo-colour (HyPer ratio). (D-K) RGC arborization at 3 dpf in control embryos (D, G), embryos treated with Nox-i (E, H), Nox-i+H2O2 (I) or H2O2 (J) from 2 to 3 dpf. (D, E) GFP expression in the [pou4f3:GAL4, UAS:GAP-GFP] larvae with or without Nox-i treatment. (F) Branch number per axon in this transgenic line. (G-J) DiO RGC labelling at 3 dpf. The maximum length of the projections was quantified (K). The n values are indicated at the bottom of each column of the graph. Representative images are shown. The error bars represent the standard error of the mean (SEM) (*p<0.05; ***p<0.001). |

H2O2 controls Shh secretion. (A-D) DiO RGC labelling at 3 dpf in control embryos (A), embryos treated with Nox-i (B), Nox-i+SAG (C) or SAG (D) from 2 to 3 dpf. The maximum length of the projections was quantified (E). The n values are indicated at the bottom of each column of the graph. Representative images are shown. (F) HyPer imaging in the glucose oxidase (Gox)-treated HeLa-HyPer cells. Scale bar, 20 µm. (G) Quantification of the H2O2 levels in the control and glucose oxidase-treated HeLa-HyPer cells. Control: n=10; Gox: n=15. (H) Western blot analysis of Shh in the cell lysates (C) or culture medium (M) upon glucose oxidase treatment. (I) Quantification of the Shh precursor following Gox treatment. Shh-precursor (Gox)/Shh-precursor (control). (J) Quantification of the amount of N-terminal Shh peptide in the medium (cf Experimental Procedures) following Gox treatment. The quantifications were performed on 5 independent experiments; a representative western blot is shown in H. (K, L) Shh-GFP fluorescence subcellular distribution in control or Gox-treated cells. Scale bar, 10 µm. (M) Shh-GFP (green) colocalized with the BODIPY TR ceramide Golgi marker (red) in Gox-treated cells. The error bars represent the standard error of the mean (SEM) (*p<0.05; **p<0.01; ***p<0.001). |

HyPer imaging in developing zebrafish embryos (20 somites) and larvae (3dpf). The H2O2 levels are inferred from the YFP500/YFP420 excitation ratio of HyPer. The calibration bar has been changed compared to Figure 1 to avoid signal saturation (A) or to be more informative for low levels of H2O2 (B). |

GFP expression pattern at 24 hpf in different transgenic lines upon Nox-i treatment. Embryos were incubated in 100 nM Nox-i or DMSO (control) from bud to 24 hpf. Rhombomeres 3 and 5 (R3 and R5) were visualized in mp311b:GFP (A-B); notochord in 2.4shh:GFP:ABC#15 (C-D); lateral line in islet:GFP (E-F and higher magnification in E′ and F′). n indicates the notochord in C and v the vitellus in E-F′. |

GFP expression pattern at 48 hpf in different transgenic lines upon Nox-i treatment. Embryos were incubated in 100 nM Nox-i or DMSO (control) from 24 hpf to 48 hpf. Monoaminergic neurons were visualized at 48 hpf in vmat2:GFP larvae (A-B). Dorsal views with the anterior part on the right. GFP positive neurons in the locus coeruleus (LC) (C) or GFP positive sympathetic neurons (Sym) (D) were counted. No significant differences were observed. Peripheral and central sensory neurons were detected in p2rx:GFP larvae at 48 hpf( E-F). Lateral views with the anterior part on the right. The triangle marks the sensory afferent of gVII; asterisk marks the afferent projection of gIX. The dotted line indicates the margins of the eye, gV trigeminal ganglia, gVII facial ganglia, gIX glossopharyngeal ganglia, gX vagal ganglia. |
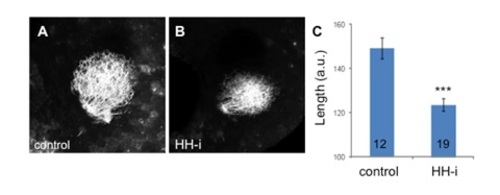
RGC projections upon cyclopamine treatment. The retinotectal projections were visualized via DiO injection in the retinas of fixed 3 dpf larvae. RGC arborization in the controls (A) and in embryos treated with cyclopamine (HH-i) (B). The maximum length of the projections was quantified (C). The n values are indicated at the bottom of each column of the graph. Representative images are shown. The errors bars represent the SEM (***p<0.001). |
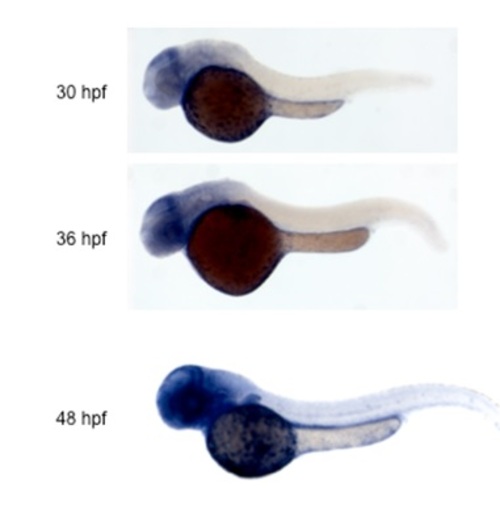
Catalase expression analyzed by in situ hybridization. |
Reprinted from Developmental Biology, 414(2), Gauron, C., Meda, F., Dupont, E., Albadri, S., Quenech'Du, N., Ipendey, E., Volovitch, M., Del Bene, F., Joliot, A., Rampon, C., Vriz, S., Hydrogen peroxide (H2O2) controls axon pathfinding during zebrafish development, 133-41, Copyright (2016) with permission from Elsevier. Full text @ Dev. Biol.